by Dong Danping, Librarian, Research Services & Tay Mui Yen, Librarian, Communications and Outreach
What is a Visual Abstract?
A visual abstract is a graphical summary of a research article that presents key findings and other essential information in a concise and visually engaging manner. It is designed to quickly communicate the essence of a research study to a broad or specific audience, such as policymakers, other academic, and or the general public. Given its attractive visual design and effectiveness in condensing complex information, it is ideal for social media sharing and dissemination.
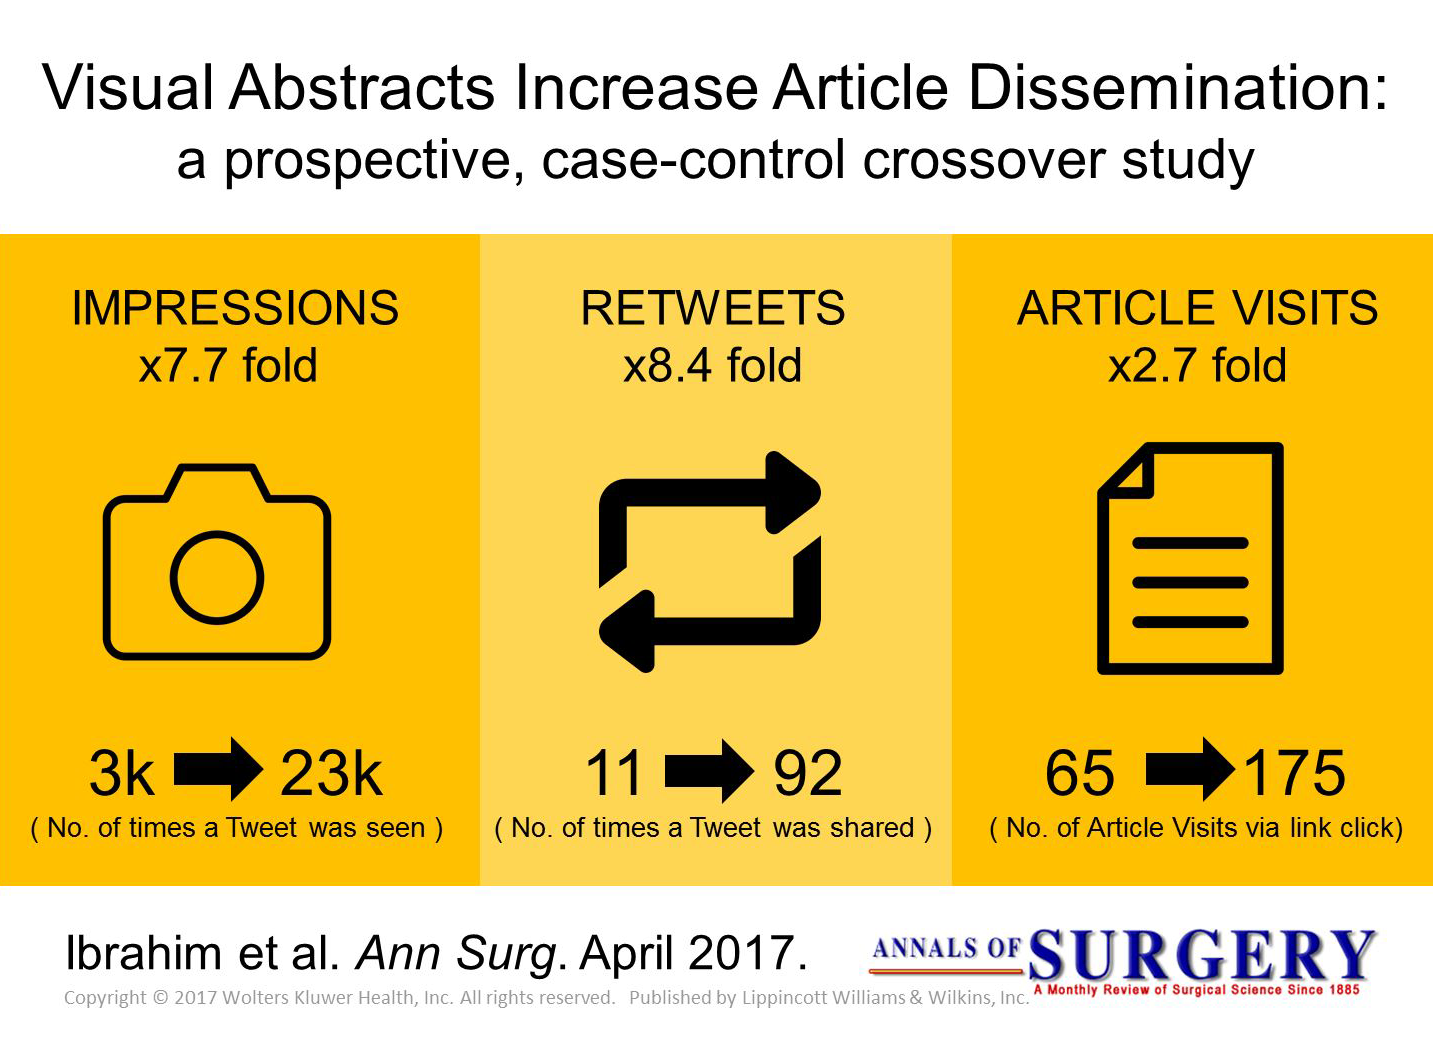
Visual abstracts have been gaining popularity in research communication. More than 100 journals or organizations have adopted the use of visual abstracts for purposes such as social media dissemination e.g. Elsevier. A 2016 study found that 47% of journals related to the social sciences have published at least one article with a graphical abstract. Another research has shown that visual abstracts are effective in disseminating research and promoting engagement around research articles on social media.
Five steps to create a visual abstract
- Define your goal of creating the visual abstract
- Identify your target audience
- Draft the content.
A good approach is to keep in mind the question “What does my audience on my selected platform want to know about my research?” As you start drafting the content, you may be tempted to provide as much context as possible. However, this may distract the readers from your key message. Instead, prioritise key message over completeness.
- Write down contextual information and/or why your research is important.
- Write down one crucial message about your research.
- List down 3-5 key points about your research.
- Are there any existing figures/graphs that can be reused/adapted?
- Design your visual abstract.
Pick a handy tool such as Canva or PowerPoint.
There are many ways to communicate your research visually. Similar to writing, you may not be satisfied with your first, second or third draft. Find out what works by rapidly experimenting with different layouts or formats.
Rather than aim for the “perfect” visual abstract, focus on iterative improvement. Seek input from people who do not know your area well to improve the clarity of your visual abstract. You can also study other designs to pick up ideas for improvement.
It is always recommended to include a citation in the footnote section and provide a link to your article in APA format. This will help readers find your article. If your paper is unpublished and not available on the internet, please include your email contact at the footnote.
- Post your visual abstract on social media, e.g., Twitter or LinkedIn.
Other than posting your visual abstract on social media, you can send it to journals that may be very willing to disseminate your research. Reuse it for slides, conferences, grant proposal pitching, and any other suitable occasions!
Visual abstracts are a powerful tool for researchers looking to communicate their findings in a more effective and engaging way. By distilling complex research into a visually appealing format, visual abstracts can help researchers reach a wider audience and potentially achieve greater impact.
Creating a visual abstract does not necessarily require advanced design skills. Even with limited experience, you can produce a simple but effective abstract in as little as 30 minutes using tools like PowerPoint. For those seeking to elevate their design, there are graphical design tools with a vast library of design elements and templates such as Canva. Don't let a perceived lack of design expertise discourage you from creating visual abstracts – try it and see how it can enhance your research communication.
Not convinced?
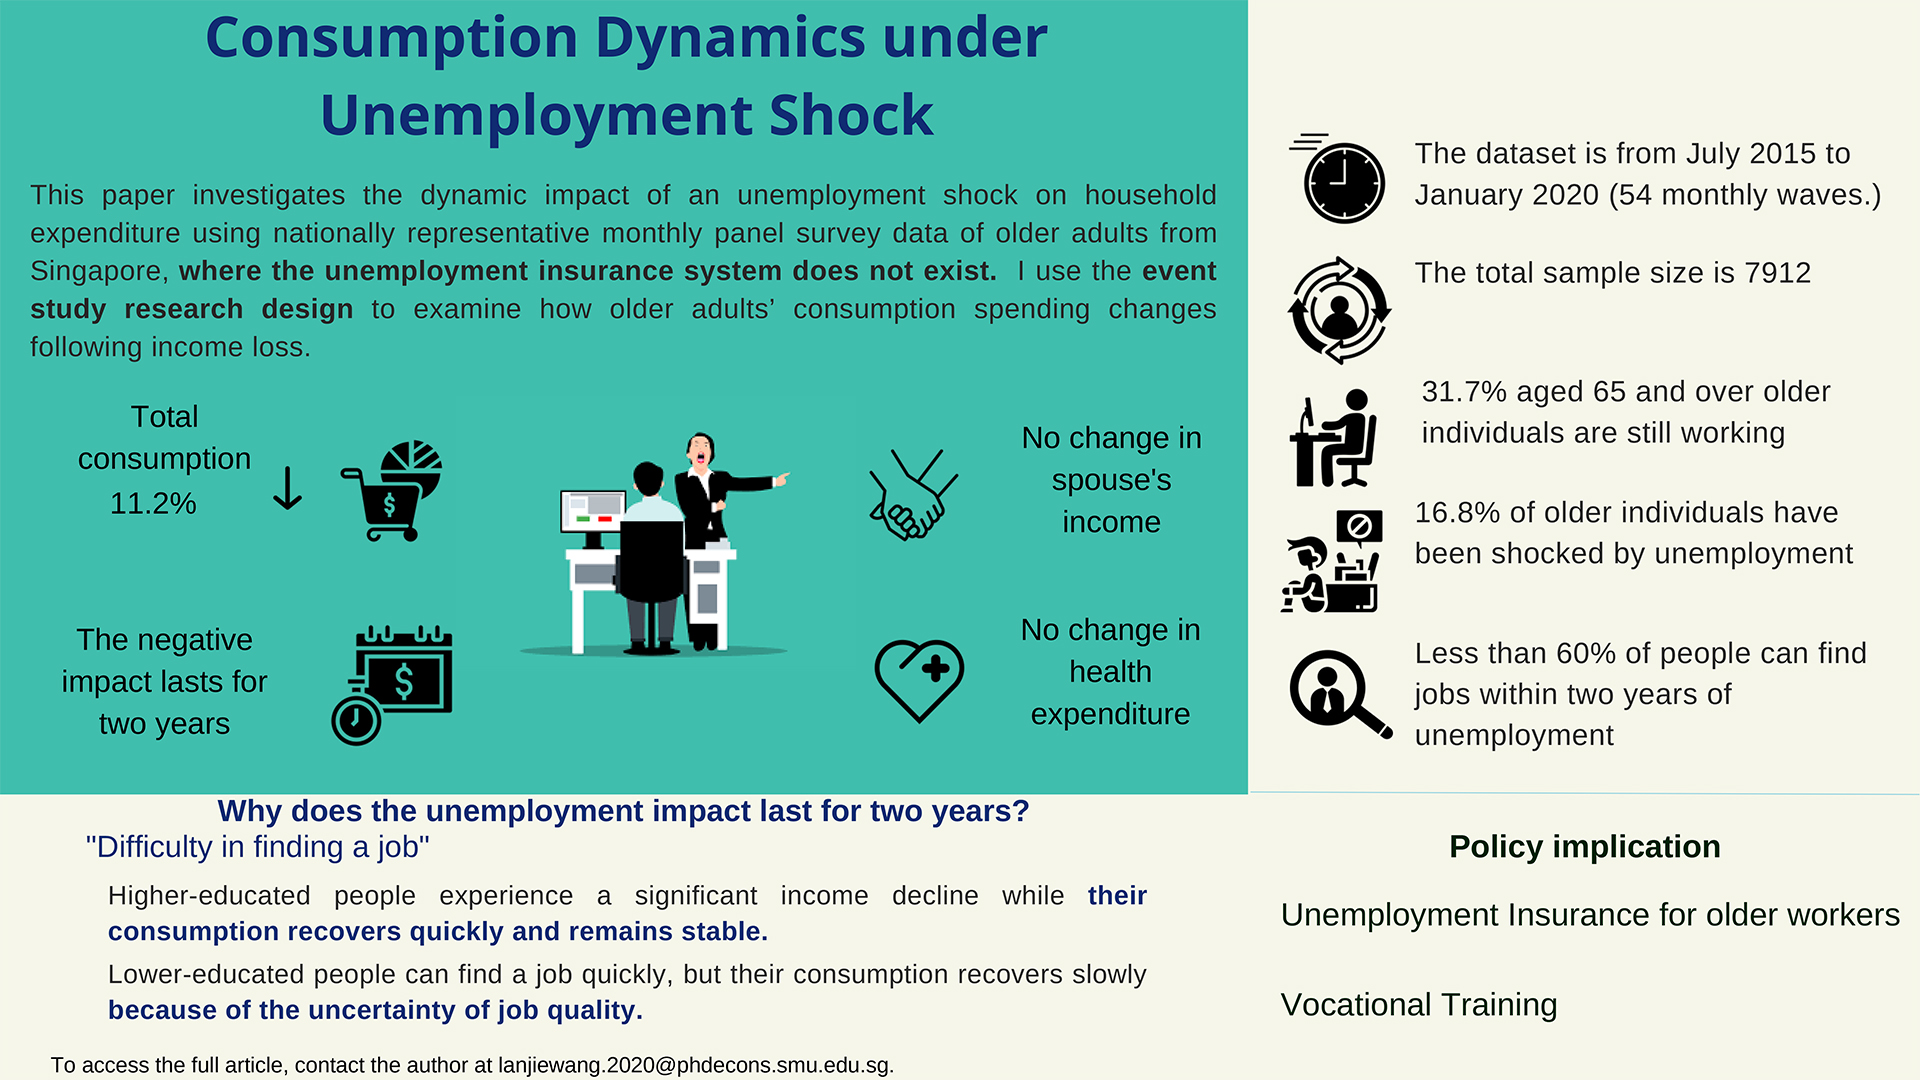
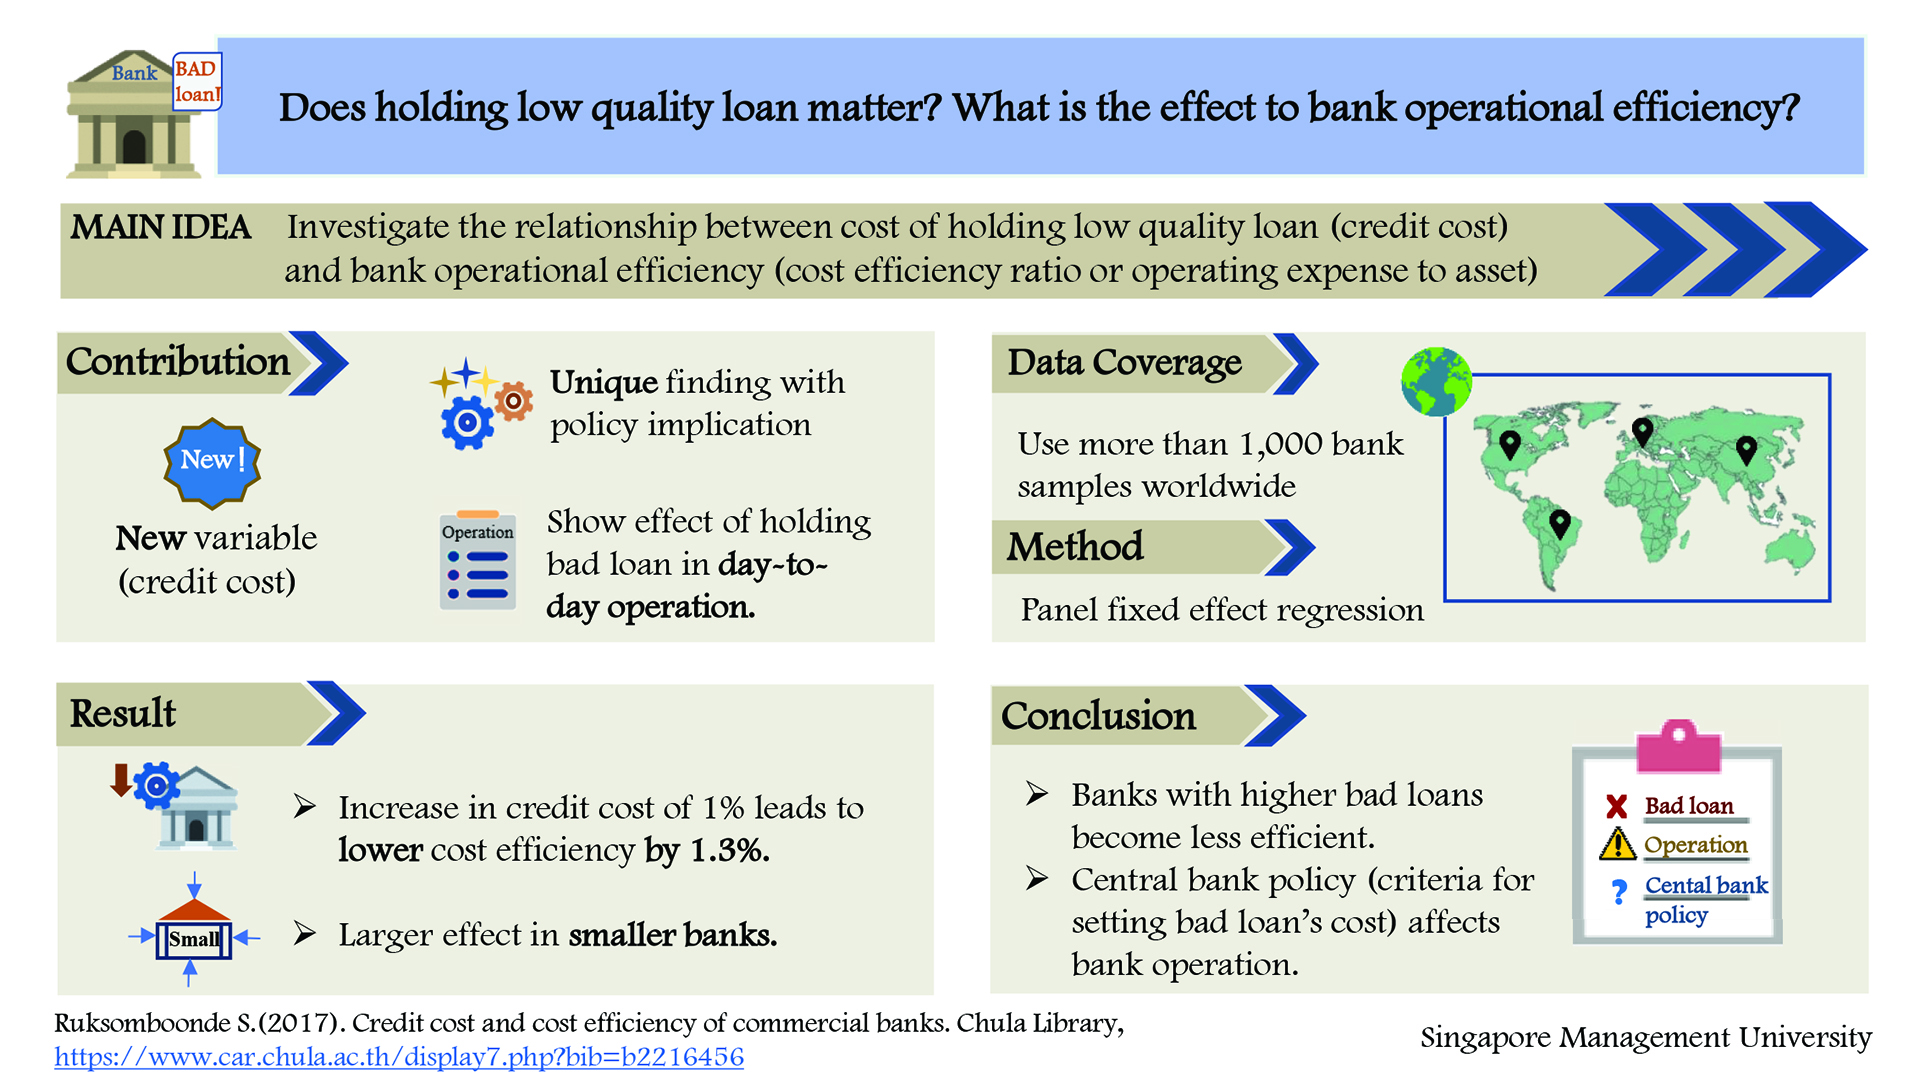
In February 2023, SMU Libraries and the College of Graduate Research Studies (CGRS) co-organised a visual abstract workshop and a visual abstract competition. Below are two competition entries created by our PhD students about their research topics.
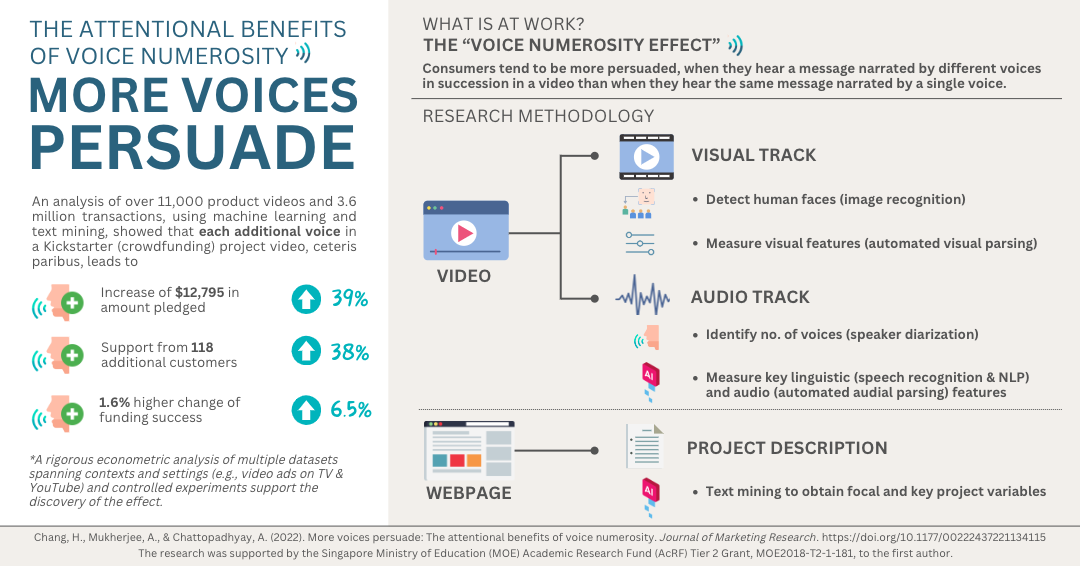
At SMU Libraries, we are currently piloting a new service to help create visual abstracts for externally funded research. The example below was made possible through collaboration with Assoc. Prof. Hannah Chang from LKCSB. If you would like to have a chat with us about Visual Abstract, contact library@smu.edu.sg or Danping (dpdong@smu.edu.sg).