


By Tee Lip Hwe, Senior Librarian, Research & Data Services
Overview
FactSet GeoRev is a dataset that provides geographic revenue breakdowns at the company level. It allows researchers to determine what proportion of a company's revenues originates from specific countries.
In Excel, GeoRev data is extracted with the FactSet =FDS function, paired with the FF_GEOREV_COUNTRY_REV data item. This article presents a scalable strategy for extracting country-level revenue across a universe of companies, that is, the full list of companies in your study.
The Extraction Formula
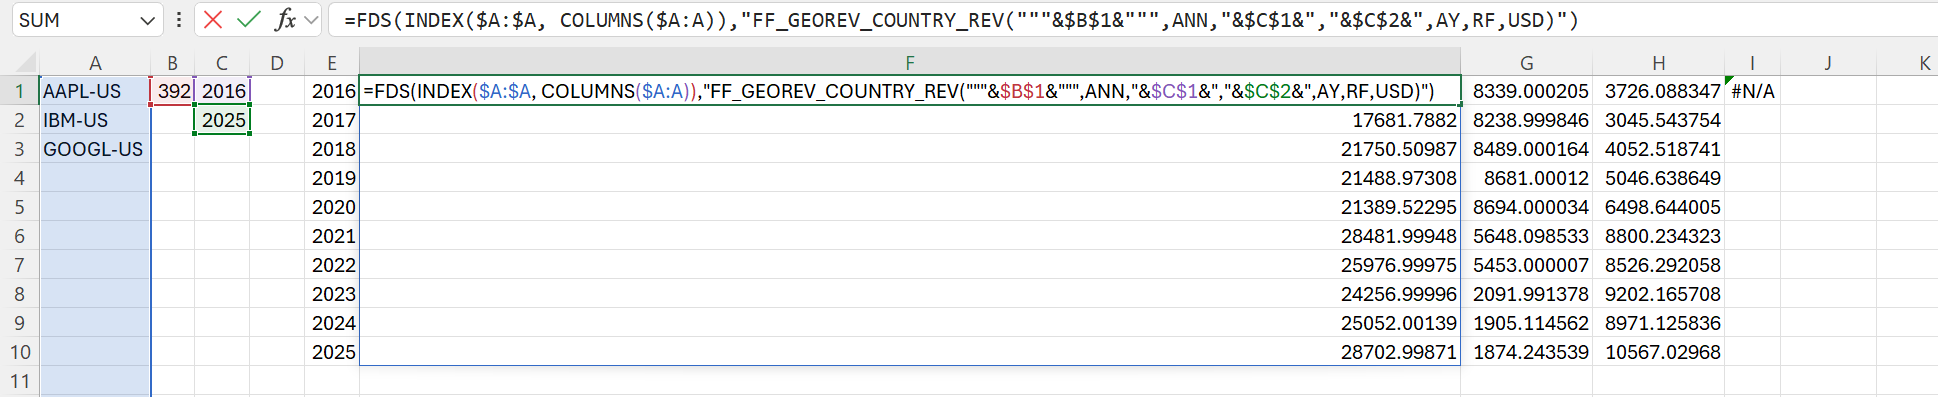
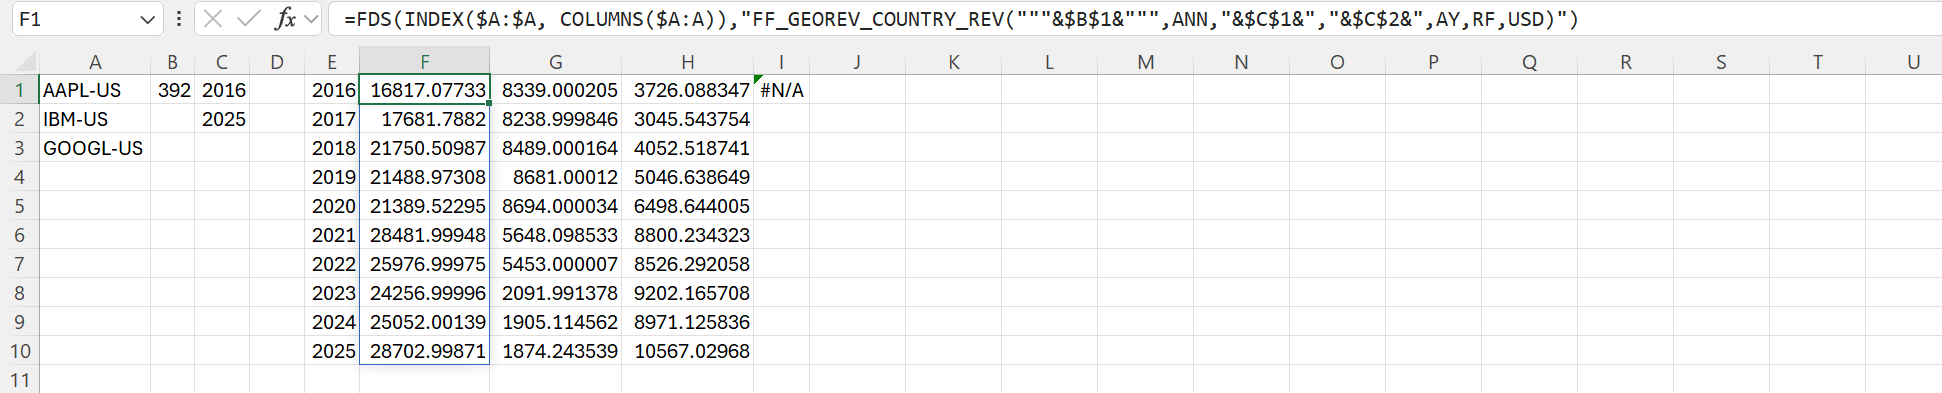
Before you start, set up your worksheet as follows: list the company tickers down Column A, one per row (for example, AAPL-US in A1, IBM-US in A2 and GOOGL-US in A3); enter the FactSet country code in cell B1 (for example, 392 for Japan); and enter the start and end dates of the extraction period in cells C1 and C2. The formula itself goes in cell F1.
The core formula is:
=FDS(INDEX($A:$A, COLUMNS($A:A)), "FF_GEOREV_COUNTRY_REV("""&$B$1&""",ANN,"&$C$1&","&$C$2&",FY,RF,USD)")
This formula is entered in cell F1 and dragged horizontally to the right. Each column corresponds to one company in the universe, which is maintained vertically in Column A. See Figure 1 and Figure 2.
Formula Parameters
The table below describes each parameter embedded in the formula:
| Parameter | Value / Cell Reference | Description |
|---|---|---|
| """&$B$1&""" | B1 = 392 = Japan | Country code |
| "&$C$1&" | C1 = Start Date | Start date of the extraction period |
| "&$C$2&" | C2 = End Date | End date of the extraction period |
| ANN | — | Report basis: Annual |
| FY | — | Frequency: Yearly - Fiscal |
| RF | — | Latest Fully Reported Period |
| USD | — | Currency: US Dollars |
How the Formula Resolves
The key idea is by defining the specific country to extract, one retrieves the full company universe.
As the formula is dragged horizontally, the INDEX/COLUMNS construct dynamically retrieves each company ticker from Column A:
COLUMNS($A:A) = 1 → INDEX($A:$A, 1) = A1 = AAPL-US
COLUMNS($A:B) = 2 → INDEX($A:$A, 2) = A2 = IBM-US
COLUMNS($A:C) = 3 → INDEX($A:$A, 3) = A3 = GOOGL-US
The country code and date parameters are fixed references ($B$1, $C$1, $C$2) and remain constant across all columns.
=FDS(INDEX($A:$A, COLUMNS($A:A)),"FF_GEOREV_COUNTRY_REV("""&$B$1&""",ANN,"&$C$1&","&$C$2&",FY,RF,USD)")
=FDS(INDEX($A:$A, COLUMNS($A:B)),"FF_GEOREV_COUNTRY_REV("""&$B$1&""",ANN,"&$C$1&","&$C$2&",FY,RF,USD)")
=FDS(INDEX($A:$A, COLUMNS($A:C)),"FF_GEOREV_COUNTRY_REV("""&$B$1&""",ANN,"&$C$1&","&$C$2&",FY,RF,USD)")
where
INDEX($A:$A, COLUMNS($A:A)) = cell A1 = AAPL-US
INDEX($A:$A, COLUMNS($A:B)) = cell A2 = IBM-US
INDEX($A:$A, COLUMNS($A:C)) = cell A3 = GOOGL-US
Why Extract by Country, Not by Company
The formula is structured at the country level: a single formula run extracts data for one specified country across all companies in the universe. To extract revenue for multiple countries, the researcher specifies each country in turn — the only modification required between runs is the country code in cell B1.
This design reflects a deliberate efficiency choice: it is more practical to iterate over countries than over companies, given that the number of countries is typically far smaller than the number of companies in a research universe.
Example: A universe of 5,000 companies across 100 countries requires 100 extraction passes (one per country), not 5,000 passes (one per company). This reduces manual effort and ensures the entire company universe is captured in each pass.
In practical terms, the country list becomes the manageable outer dimension of the extraction, while the formula retrieves the company universe for each specified country. This structure also makes the resulting country-revenue panel easier to organise and process.
| Design choice | What changes between runs | Why it matters |
|---|---|---|
| All companies by country | The country code or country parameter | The smaller country list drives the workflow; the company universe is retrieved as a block. |
| All countries by company | The identifier for every company | The larger company list drives repeated extraction, which is less efficient when companies greatly outnumber countries. |
Extraction Design Principles
The formula is designed to scale horizontally across a large number of companies simply by dragging it to the right. Three design principles underpin this scalability.
Vertical Universe in Column A
The company universe is maintained vertically in Column A rather than horizontally across Row 1. This layout accommodates changes to the universe — adding, removing, or reordering companies — without altering the formula. When the formula is dragged horizontally, COLUMNS($A:A) increments automatically to reference successive rows in Column A.
Use of INDEX Instead of Hard-Coded Tickers
Using INDEX($A:$A, COLUMNS($A:A)) instead of hard-coded ticker symbols means that any modification to the company list in Column A is automatically reflected in the output. The formula does not need to be manually updated when the universe changes.
Separating Parameters from Logic
Key parameters — country code, start date, and end date — are stored in dedicated cells (B1, C1, C2) and referenced via absolute cell addresses. This separation of parameters from formula logic means that a researcher can change the country of interest or the time period by updating a single cell, rather than editing every formula in the row.
“Good extraction design separates parameters from logic.”
Identifying Data Items via the FactSet Sidebar
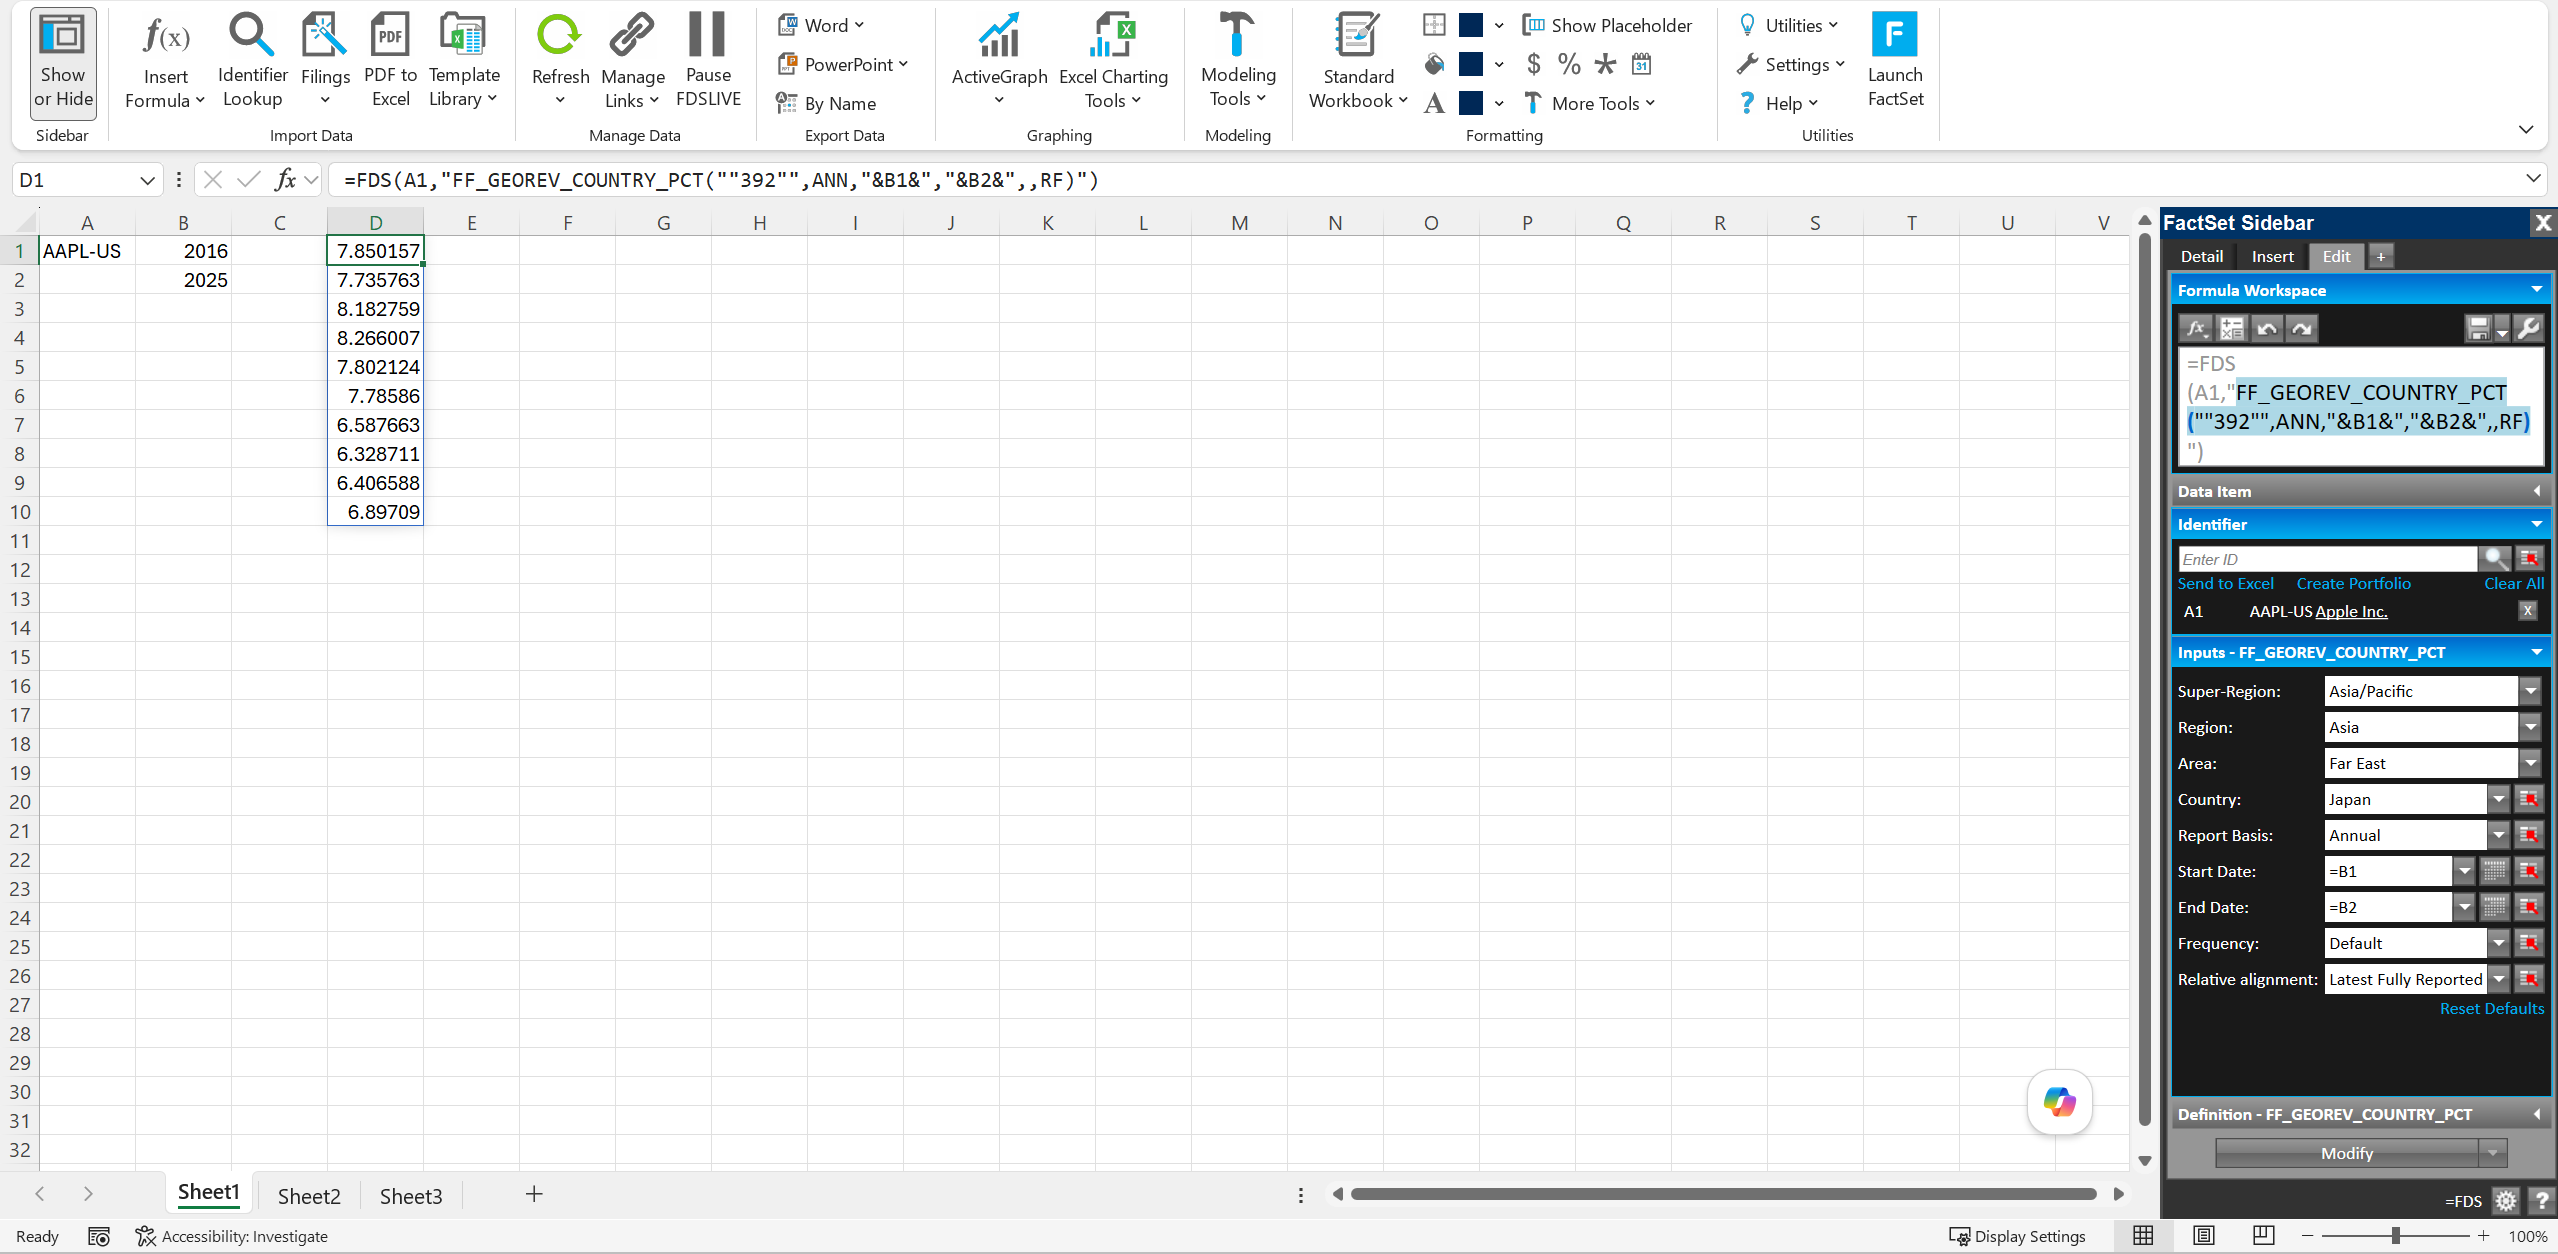
The FactSet Sidebar (available within Excel after installing the FactSet Add-In) can be used to search for and validate available data items. To locate FF_GEOREV_COUNTRY_REV or explore alternative GeoRev variables:
- Open the FactSet Sidebar from the Excel FactSet ribbon.
- Navigate to the Insert tab and search for "GEOREV" or "country revenue".
- Select the relevant data item to view its syntax, available parameters, and usage examples.
- Use the formula builder within the Sidebar to construct and test the formula before deploying it across the full universe.
Summary
This article presents systematic extraction of country-level revenue data across potentially large company universes with FactSet GeoRev. The recommended Excel approach uses FF_GEOREV_COUNTRY_REV with an INDEX/COLUMNS construct that references a vertical company list and parameterised country codes. Key advantages of this design include:
- Scalability — the formula handles thousands of companies without modification.
- Flexibility — universe changes in Column A propagate automatically.
- Efficiency — iterating by country (<200) is far more efficient than iterating by company (potentially thousands).
- Maintainability — parameters are separated from logic, enabling quick reconfiguration.
This extraction methodology reflects sound research data practice: each element of the formula operationalises an explicit research decision about entities, variables, time periods, reporting conventions, and currency representation.
“A financial-data extraction specification is more than a technical instruction: it operationalises research decisions about what entities, variables, dimensions, time periods, reporting conventions, and representations will enter the empirical dataset.”
TL;DR
The document explains how to use FactSet's GEOREV FF_GEOREV_COUNTRY_REV formula to extract company revenue by country, utilising Excel functions like INDEX and COLUMNS to dynamically reference a potentially large vertical list of companies in Column A and parameters such as country codes and date ranges stored in specific cells. It highlights the rationale for keeping the universe of companies vertical while dragging the formula horizontally to accommodate changes in the list, avoid hard-coding, and separate parameters from logic for flexible, metadata-rich financial data extraction. In short, the extraction design presented here emphasises scalability, flexibility, and sound research-data practice by separating the company universe from the formula logic and retrieval parameters.
Notes
To access FactSet Workstation, visit Investment & Data Studio at Li Ka Shing Library.