By Samantha Seah, Librarian, User Services & Experience
If you've worked with scientific or technical type-writing for your assignments, publication submission, collaborative writing in LaTeX, etc., you would have been using Overleaf. Well known to be the predominant platform to typeset your own documents and work collaboratively with other researchers, it seems to have cornered the market for researchers writing in LaTeX especially with their integrations with other research-related software such as GitHub and Zotero. They also maintain tutorials, documentation, and webinars to support new learners.
Enter OpenAI's Prism boasting unlimited projects, collaborators, and compilation time with the integration of GPT-5.2 for anyone with a ChatGPT personal account for free. The integration of AI features has become an expectation in recent years and notably while Overleaf has introduced their own AI features in their partnership with Writefull, it is an add-on which requires separate subscription from the premium subscription users of Overleaf will already have to pay for. Will this compel users to make the switch from Overleaf to Prism? In this article, I intend to do a comparison of the features and user experience of both to help you make a more informed decision.
SMU Libraries subscribe to Overleaf (standard) premium but not ChatGPT credits, so for this examination I will be checking features in both the free and premium versions of Overleaf and Prism without any subscription.
Feature Summary
Let's have a look at their features at a glance:
| Overleaf (free) | Overleaf (premium) | Prism | |
|---|---|---|---|
| Project management | |||
| Number of collaborators | 1/project | 10/project | Unlimited |
| Number of projects | Unlimited | Unlimited | Unlimited |
| Compile timeout | Basic | 24xBasic | Never |
| Compile speed | Fast | Fastest | Unlimited |
| Writing | |||
| Templates available | Yes | Yes | No but you can prompt to generate |
| Document history | No | Yes | No |
| Symbol palette | No | Yes | No |
| Visual editor (WYSIWYG) | Yes | Yes | No |
| AI assistant | No | No (AI assist is an additional subscription) | Yes |
| Generate code from an uploaded image | No | No | Yes |
| Generate code from voice recording | No | No | Yes |
| Integrations | |||
| Integration with reference manager | No | Yes: Papers, Mendeley, Zotero | Yes: Zotero |
| Integration with GitHub | No | Yes | No |
| Integration with Dropbox | No | Yes | No |
Depending on which features you prize, hopefully the table above will help you get a better understanding of the pros and cons of each platform. Prism immediately looks appealing even if you already have a premium Overleaf account with its unlimited collaborators, compilation time, and AI features already available. So let's explore further into a few of these features to see how well they work, the one that particularly piques my interest is being able to generate code from an uploaded image since it would make it easier to craft complex equations, graphs, or diagrams.
Drawing graphs
To test the diagram re-creation abilities, I went into one of my existing Overleaf projects and took a screenshot of a plot I had, pasted it into Prism's prompt bar and asked "Create a new section for 3D plots and recreate the attached diagram."
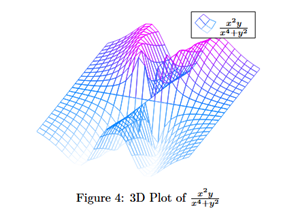
To its credit, it recognised that the TeX file was missing the package to plot graphs and added in pgfplots package, compat=1.18 to the preamble. Without looking at the code for the plot itself, I tried to compile and was met with the following error —

Having a look at the code, we can compare my original verses the code generated from the image:
| Original | Generated |
|---|---|
\begin{figure}[h!]
    \centering
    \begin{tikzpicture}
        \begin{axis}[
            hide axis,
            colormap/cool,
        ]
        \addplot3[
           mesh,
        ]
        {(x^2*y)/(x^4+y^2)};
\addlegendentry{$\frac{x^2y}{x^4+y^2}$}
        \end{axis}
    \end{tikzpicture}
    \caption{3D Plot of $\frac{x^2y}{x^4+y^2}$}
    \label{fig:3dplot}
\end{figure} | \begin{figure}[h]
\centering
\begin{tikzpicture}
\begin{axis}[
width=0.85\linewidth,
view={35}{35},
axis lines=none,
ticks=none,
domain=-4:4,
y domain=-4:4,
samples=35,
samples y=35,
colormap/jet,
mesh/ordering=y varies,
mesh,
z buffer=sort,
]
\addplot3[
mesh,
draw=blue!60!magenta,
]
({x},{y},{(x^2*y)/(x^4 + y^2 + 1e-6)});
\node[
anchor=north east,
draw,
fill=white,
inner sep=2.5pt,
font=\small
] at (rel axis cs:0.98,0.98)
{$\dfrac{x^2 y}{x^4 + y^2}$};
\end{axis}
\end{tikzpicture}
\caption{3D Plot of $\dfrac{x^2 y}{x^4 + y^2}$.}
\end{figure} |
Immediately the difference in the code length is obvious, while none of the elements are wrong (that I can tell), many of the lines are redundant. It took a bit of trial and error but I was finally able to compile and render the plot when I changed the colormap value from jet to cool (which was the original map it should have been). Oddly enough, jet is an acceptable value for colormap so I am still not sure what stopped it from compiling.

If we look at the plot that is rendered, we can notice that the legend is only half showing and not "at the top-right" as written in the generated code comments. This is trivial to correct but it is worth noting that even with a screenshot of a plot you may have to clean up the code to get it working and/or showing how you would prefer it.
Creating diagrams from description
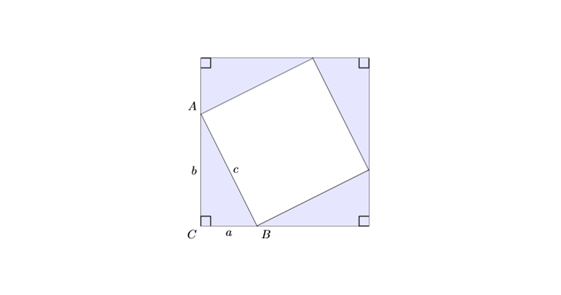
In another experiment, I prompted Prism to add in a proof of the Pythagoras Theorem and add an illustration to accompany the explanation. This shows the start of the proof and the diagram —
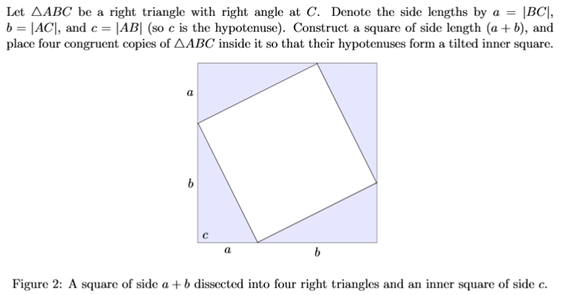
The figure is noticeably missing some elements such as the vertices A, B, and C of the triangle, the right-angle notation at the corners of the shaded triangles, and the hypotenuse c is at the corner instead of along the hypotenuse/side of the tiled inner square.
Instead of manually adding the elements, I tried to prompt it to add the labels and the right-angle notation to all triangles. Perhaps I should have been more specific.
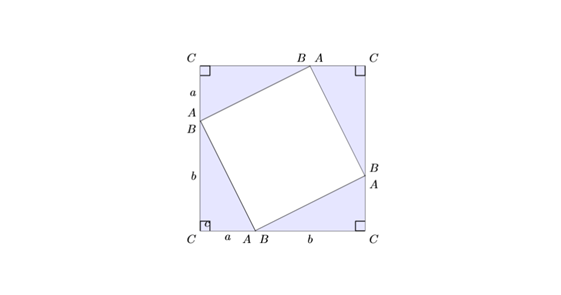
After manually removing the As, Bs, and Cs from all but the bottom left triangle, I tried to get the 'c' from the bottom left corner to the side of the interior square since c is supposed to denote the length of AB and the hypotenuse of the triangle ABC. For reference, these were the prompts I used — "move c to denote the hypotenuse of the triangle ABC" and "move c to denote the length of AB" both failed when the code tried to compile.
In an examination of the code, this error box popped up —

At this point, I was very confused at how difficult this simple task was and was more frustrated by how many lines it took to accomplish it. Especially when it was not as complicated as the error message makes it out to be; I finally manually changed the coordinates and got it to work.
To illustrate how overly complicated Prism's generated code is, let's compare the code for drawing and labelling a simple triangle:
| Original | Generated code |
|---|---|
\begin{tikzpicture}
    \draw (0,3)
    coordinate[label=left:$A$] (A)
    -- node[midway,left] {$b$}
    (0,0)
    coordinate[label=left:$C$] (C)
    -- node[midway,below] {$a$}
    (2,0)
    coordinate[label=right:$B$] (B)
    -- node[midway,sloped,above] {$c$}
    cycle;
\end{tikzpicture} | \begin{tikzpicture}[scale=1.0, line join=round]
% Points
\coordinate (E) at (0,0);
\coordinate (D) at (0,3);
\coordinate (F) at (4,0);
% Triangle
\draw[thick] (D) -- (E) -- (F) -- cycle;
% Right-angle marker at E
\draw[thick] (E) -- (0.45,0) -- (0.45,0.45) -- (0,0.45);
% Side-length labels
\node[midway,above,left] at ($(D)!0.5!(E)$) {$f$};
\node[midway,below] at ($(E)!0.5!(F)$) {$d$};
\node[midway,above,right] at ($(D)!0.5!(F)$) {$e$};
% Labels
\node[left] at (D) {$D$};
\node[below left] at (E) {$E$};
\node[below] at (F) {$F$};
\end{tikzpicture} |
In essence, the generated code broke down each step of creating the triangle diagram into first locating where each vertex should be, then drawing the triangle, then labelling each vertex and side. Whereas it would have been more intuitive to combine all of these into a single \draw command turning 20 lines of code into less than ten. Would it be helpful for someone trying to learn how to draw a diagram? Perhaps. I do appreciate the comments it leaves to indicate what each portion of the code is trying to accomplish. But it is also inelegant and cumbersome and I personally think it would annoy an experienced hand.
Suggesting references
Admittedly when I saw this in Prism's promotional video, I was confused why users would be asking the AI to suggest papers to cite since they should already have done the research to write the paper but I guess this could be a way to discover more papers. In any case, I decided to test it out anyway. I tried this twice with the same content in the document to see if there were any differences (1) in the references recommended and/or (2) in the generated code.
Let's look at the resources recommended first.
Attempt #1:

Attempt #2:

Interestingly the second attempt included more resources on the rest of the document and even for the resources on the same topic it suggests different ones to consider, with the exception of Euclid's Elements. The presentation of the references is also different with the second attempt listing the year of publication up front.
It did create a .bib file and format all the suggested references into bibtex format and was able to print the bibliography upon compilation. However, the references change again. I've made a copy of the project as a read-only file, you can see the references file created and how the tex file was edited as well. This is where I ran into some curious issues. The first two resources were not open access and I had a difficult time verifying the content. The Eves (1990) reference which was originally suggested also made no appearance in the .bib file and seems to have been replaced by other similar titles. On a positive note, it does not look like any of the references provided are hallucinated. However, the question remains whether users would actually read the references to verify their relevance before including them in their list of references.
It created a new section titled 'References' unnecessarily since the header for the section would already be printed along with the bibliography but that is easy enough to remove. Another odd occurrence I noted was that it inserted the references at the end of the section instead of at the end of the document, perhaps because I inserted a page break after the aforementioned section.

Overall impression
I am struggling to come to a conclusion on who Prism is meant for in this brief experimentation with Prism. On the one hand I think it could be very useful for users who need to write in LaTeX to have free access to all features especially unlimited compilation time and unlimited collaborators. On the other hand, the other features which would be most useful for beginner users of LaTeX seems to be only halfway functional, sometimes generating code which cannot even compile or inelegant code which makes the .tex file unnecessarily long.
It also lacks some of the more core features I have come to appreciate from Overleaf such as the Visual Editor and the Symbol palette. Ultimately I think it comes down to an individual's level of experience in using LaTeX and if you already use AI tools in your writing process. I can undoubtedly see how beneficial it can be not to write code for diagrams or tables from scratch but this also comes with a caveat that you would also know how to troubleshoot issues when you encounter errors. For the experienced LaTeX user, I can see how Prism could help to speed up certain parts of writing especially if you already know where to tweak the code to get what you want with all the added benefits of AI integrations but I can also see how it can get frustrating if you are used to more efficient styles of coding. Either way, I hope this exploration has provided some insight into the more unique features of Prism and highlight some drawbacks in real situations.
If you are interested in exploring yourself, you can access Prism for free here or if you're interested in a premium Overleaf subscription, write to us at library@smu.edu.sg.