
By Tee Lip Hwe, Senior Librarian, Research & Data Services
Trading volume serves as a foundational metric for analysing trading behaviour, market structure, and dynamics over time.
The Bloomberg's RANK <GO> function shows brokers' advertised trade volumes after trades are completed, and generates historical reports, ranking brokers by specific securities, exchanges, indexes, etc.
This write-up serves to provide a trading intelligence use case of RANK <GO> in the retrieval of large-scale trading volume data (by broker as well as security) for research.
Steps to Mass/Bulk Downloading of Bloomberg's Trading Volume Data (by Security and Broker) in RANK <GO>
Retrieving the Broker Vols, i.e. 'the amount of volume reported by the respective broker, represented in the actual shares traded', of all securities traded by a particular broker can be performed. This is done by setting/specifying the 'Composite Exchange'.
Here is example using the Composite Exchange 'US' for the Time Period of 2019.
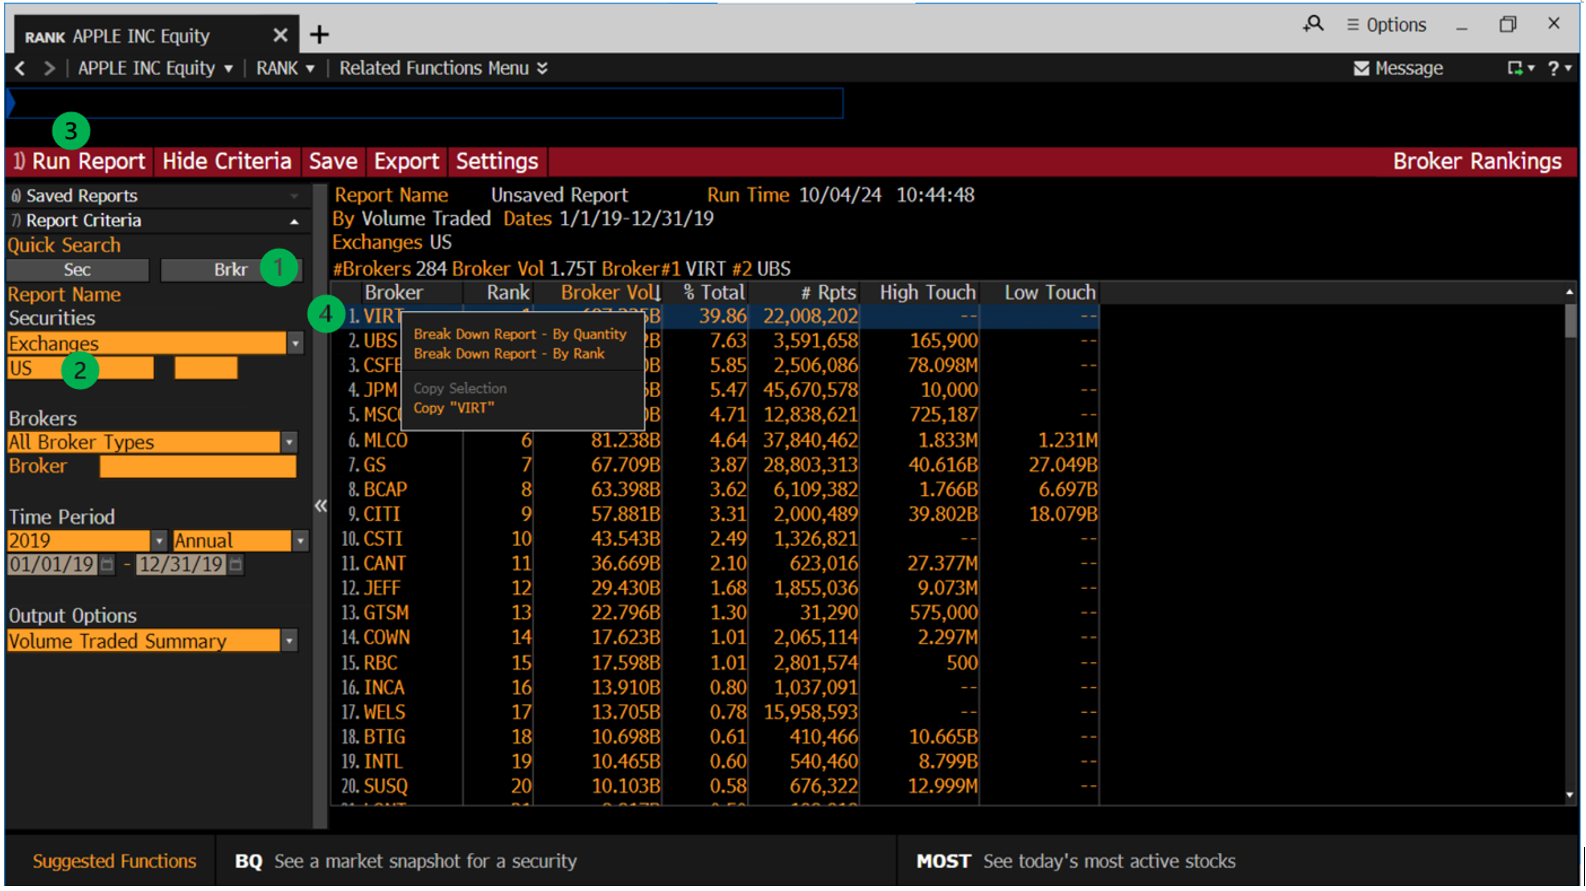
Steps:
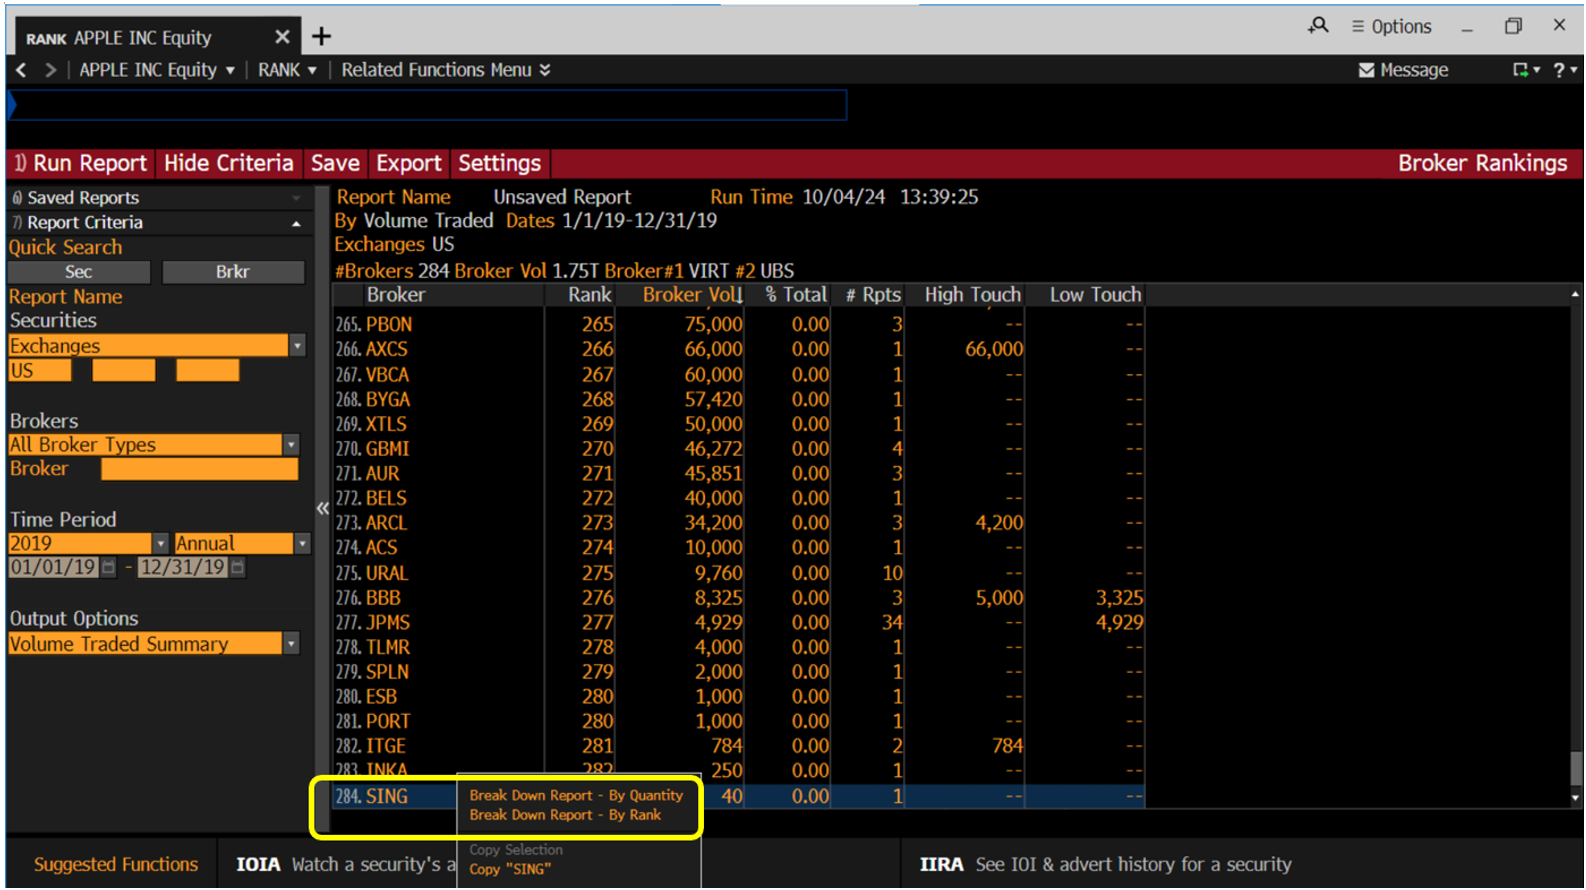
- click Brkr
- select Exchanges and input US
- click Run Report
- right click on the broker VIRT (i.e. first broker in the Report/listing) and click Break Down Report -- By Quantity
From the Break Down Report generated,
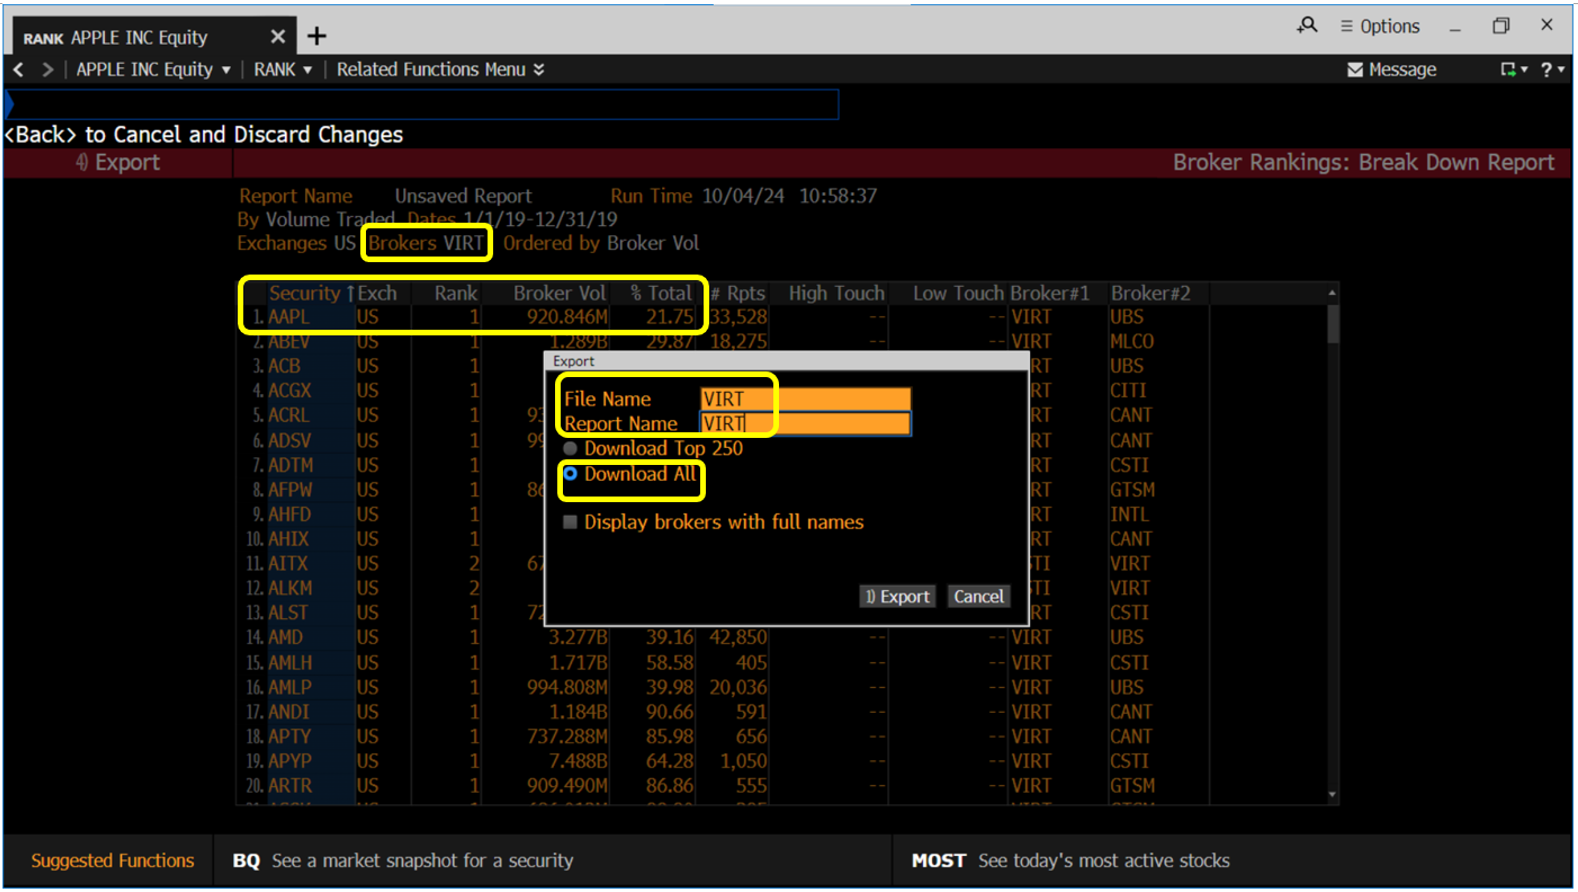
Export steps:
- click Export
- input File Name and Report Name. Here both are input as VIRT.
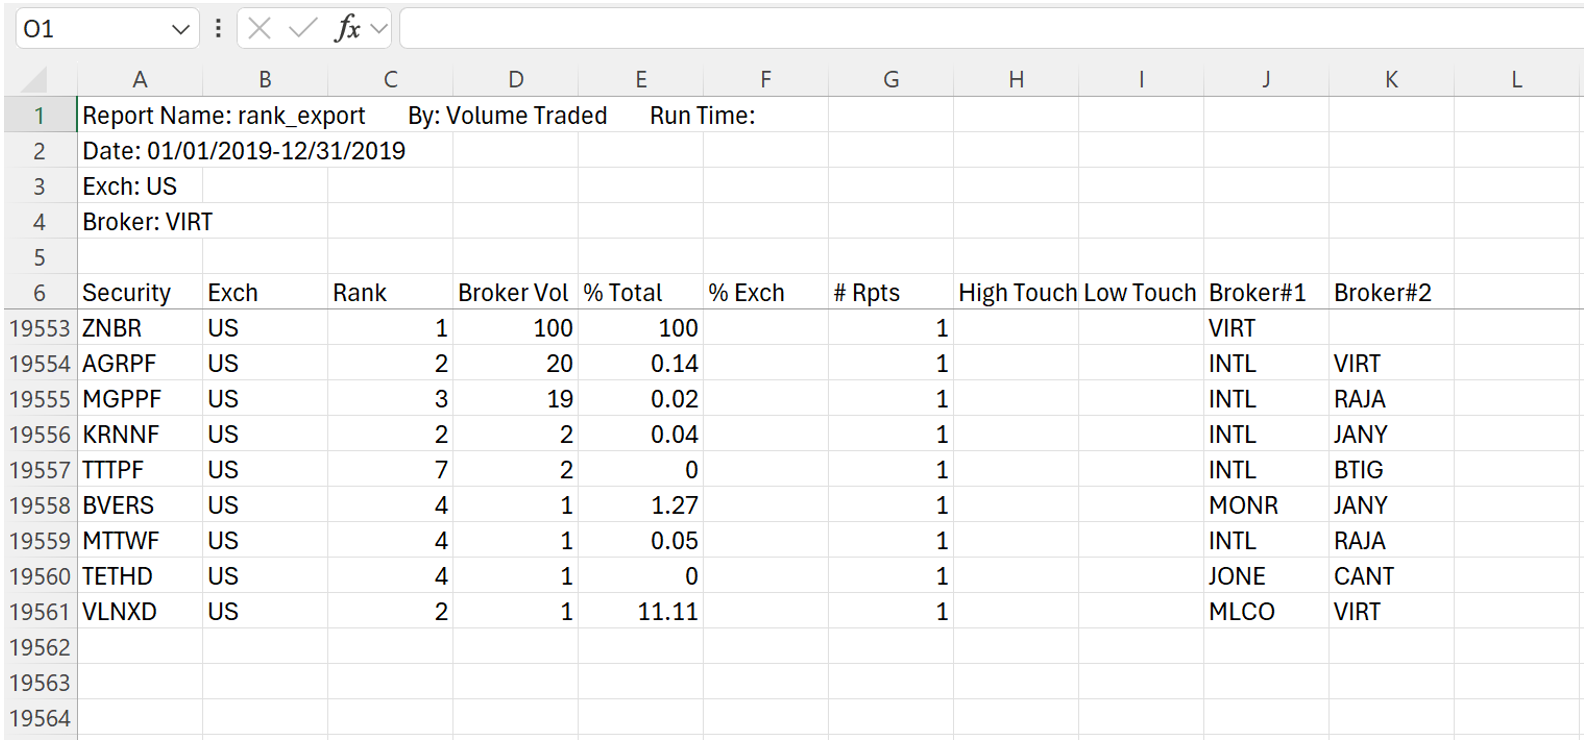
- select Download All. A total of 19555 securities are exported at one go for this broker VIRT.
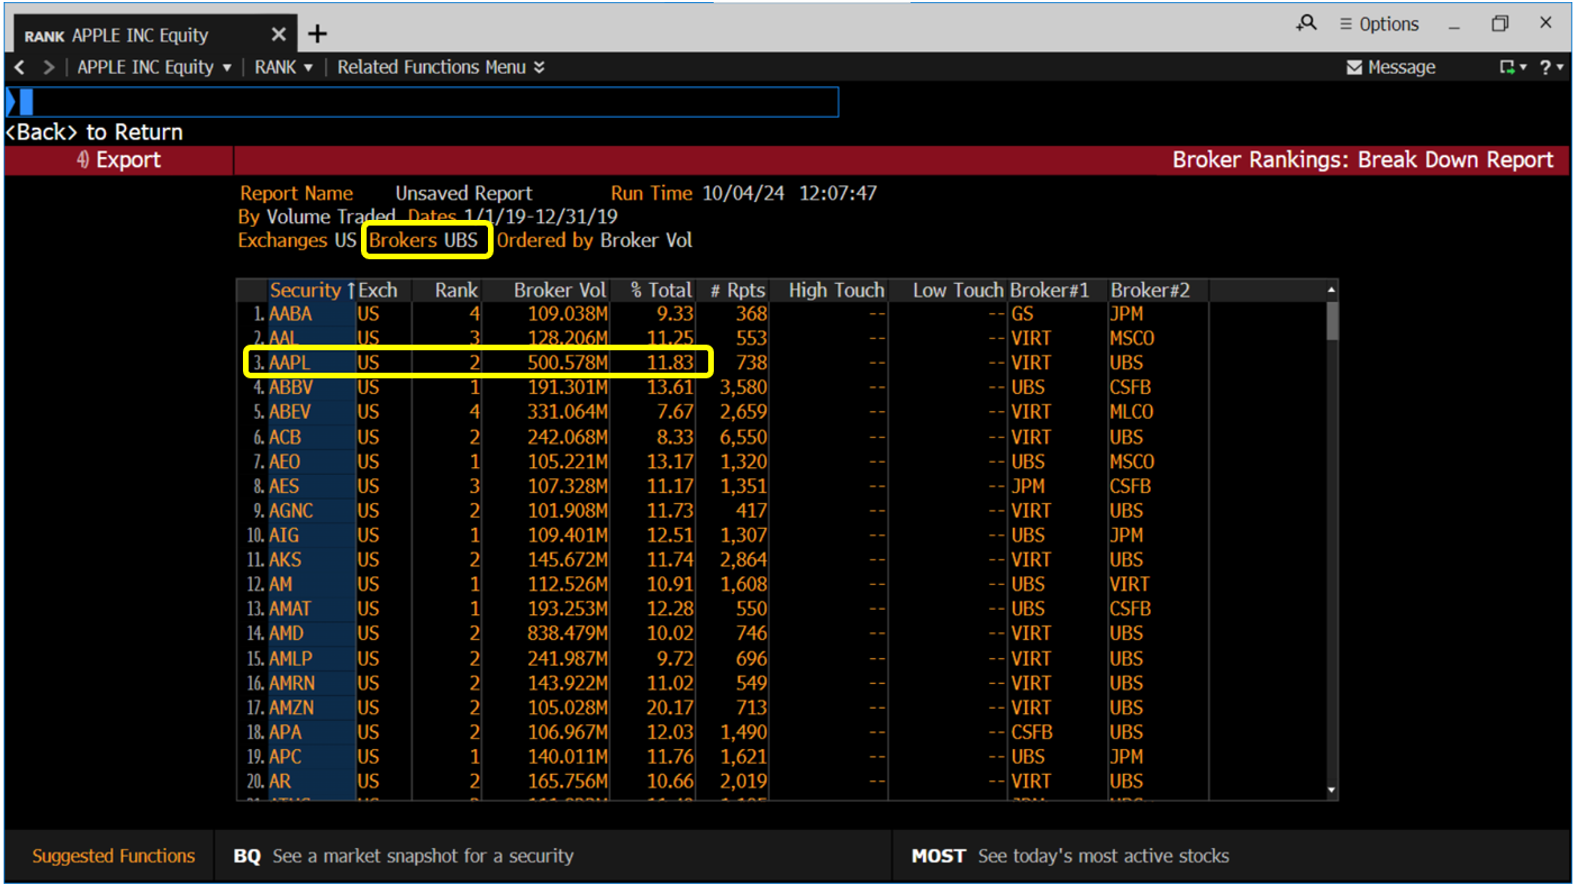
Finally, repeat for the next broker UBS and so on to generate the Break Down Report, and export all the securities traded by the broker at one go.
Justification/Rationale and Note on Time Period Granularity
Bulk data downloads are being discussed to support research requiring broad/extensive data coverage.
The justification/rationale for mass/bulk downloading by individual Broker over individual security is that, mathematically speaking, the number of brokers is much smaller than the number of securities. In this example using the Composite Exchange 'US' (with respect to Time Period given), the total number of brokers is less than 300 (starting with VIRT and UBS and so on).
On Time Period granularity, data can be aggregated by the whole year or by specific day, month, or quarter. Choosing more granular periods (e.g., quarterly or monthly) clearly increases the number of required extractions. For example, aggregating by quarter instead of year increases the extraction volume ~3x for 2019. If annual aggregation is preferred, there is requiring just less than 300 extractions for 2019 per se.
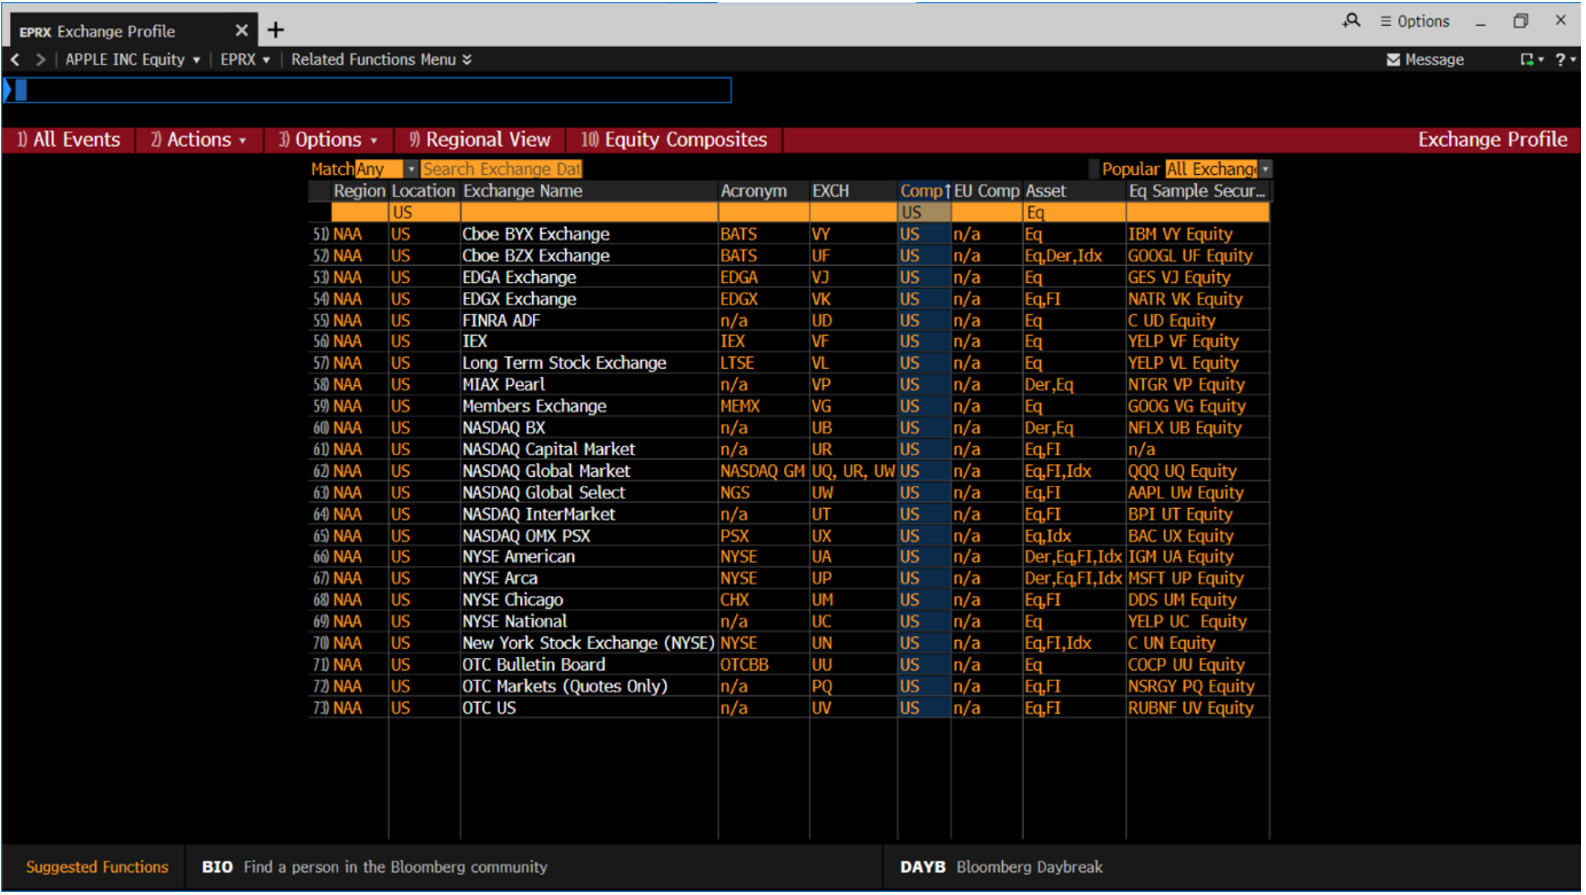
Side Note on Composite Exchange 'US'
For an overview of Composite Exchange 'US', check out the Exchange Profile function (EPRX <GO>).
Summary
Bloomberg's RANK <GO> function provides broker rankings based on trading volume for securities, across different time intervals. This data allows researchers to observe patterns of broker activity, concentration, and dominance in trading.
Discover Bloomberg Terminal for in-depth market insight and research.
References
Bloomberg L.P. (2024). Bloomberg Terminal.