By Aaron Tay, Lead, Data Services
As noted in a past ResearchRadar piece, reviews as an article type are becoming more popular in the Business and Management areas. Among some of the Bibliometric mapping (also known as science mapping/network mapping tools) mentioned in such reviews, VOSviewer was by far the most popular, mentioned in the title/abstract/Keyword of Scopus as many as 98 reviews in Scopus.
For an example of a recent review written by a SMU author that uses VOSviewer, see - “Employer and internal branding research: a bibliometric analysis of 25 years” (Saini et al., 2022) where the paper uses both VOSviewer and Biblioshiny software packages to conduct a bibliometric analysis of over 25 years of Employer and internal branding research.
In this ResearchRadar piece, we will briefly introduce the VOSviewer tool. In a future piece, we will discuss Biblioshiny which was ranked as the third most popular science mapping tool in our past ResearchRadar "Bibliometric reviews in business, management & accounting and the tools used".
Below we briefly show how VOSviewer can be used in bibliometric analysis or often called bibliometric reviews in the business, management and accounting areas. If you are interested in learning more or have questions about VOSviewer, do contact me.
Background
VOSviewer was first launched as a free bibliometric mapping tool in 2009 by Nees Jan van Eck and Ludo Waltman at Leiden University's Centre for Science and Technology Studies (CWTS).
VOSviewer is a tool that uses the VOS Mapping technique, invented by the same authors. VOS stands for visualisation of similarity and aims “to provide a low-dimensional visualisation in which objects are located in such a way that the distance between any pair of objects reflects their similarity as accurately as possible” (van Eck & Waltman, 2007, p. 299).
In other words, VOSviewer produces “distance-based maps” where “the distance between two items reflects the strength of the relation between the items” (van Eck & Waltman, 2010), this is in contrast to “graph based maps” where distance between items may not represent relationships or similarities but instead lines or edges between items are used to show relationships. CiteSpace which we cover in another ResearchRadar piece produces such maps.
VOSviewer is not the first or only bibliometric software to construct distance-based maps, however because the VOS Mapping technique shows good performance compared to other mapping techniques that produce distance-based maps, VOSviewer is capable of generating fairly large-scale maps of over 5,000 items in a co-citation map for example in a fairly short period of time.
It is probably the most popular science mapping/bibliometric mapping tool in use right now, followed by CiteSpace and Bibliometrix/Biblioshiny.
General features
- Accepts inputs from a wide variety of bibliometric sources including Web of Science, Scopus, PubMed, Lens.org, Dimensions, Semantic Scholar, COCI and more.
- Accepted input as exports from standardised formats and popular networking tools like GML, JSON, Pajek.
- Provides four types of citation-based analysis including Co-authorship, Citation, Bibliometric coupling and Co-citation at multiple levels of analysis (e.g., author, journal, organization, country) as well as keyword co-occurrence and term (title+abstract) co-occurrence maps.
- Besides the standard network view, each map can also be viewed with density overview and overlay overview.
- VOSviewer Online feature that allows sharing of interactive visualizations created with VOSviewer with the data file stored in Google Drive, Dropbox, Onedrive.
A typical use of VOSviewer, works like this.
- Search for relevant papers in your topic by entering keywords in supported databases like Scopus, Web of Science etc.
- Extract the bibliometric information of these papers (which typically varies from 100-10,000 documents) in the appropriate format – typically csv or RIS
- Import the file export from step 2 into VOSviewer, by selecting the appropriate option corresponding to your file
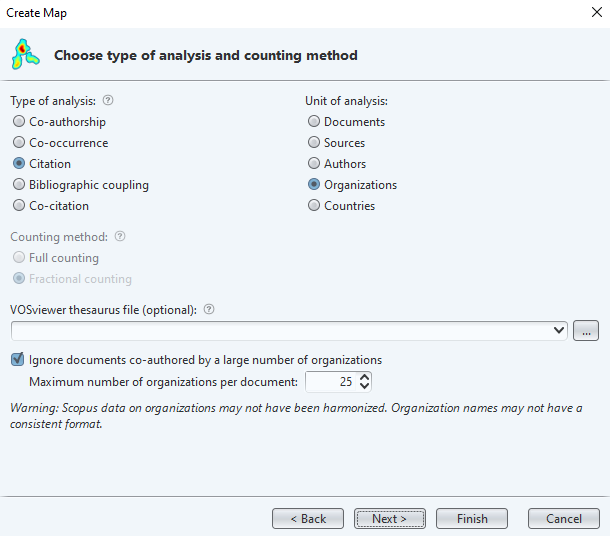
Select the type of analysis you want to use and other settings e.g., Unit of analysis, counting method
- Choose thresholds for which you want to exclude nodes (e.g., exclude all papers which has less than 50 cites) to exclude less important paper and to make it easier to see clusters or pattern.
- Visualise!
Pros
Broadest support of sources – allows inclusive mapping of sources if desired
While the latest and most updated bibliometric tools go beyond just supporting traditional sources like Web of Science and Scopus, VOSviewer has outdone itself. Counting bibliometric sources alone, it supports 12 mostly open sources including Dimensions, Semantic Scholar, PubMed, Lens and more. In particular it supports the very recent and important source - OpenAlex, which is the successor to the discontinued Microsoft Academic Graph.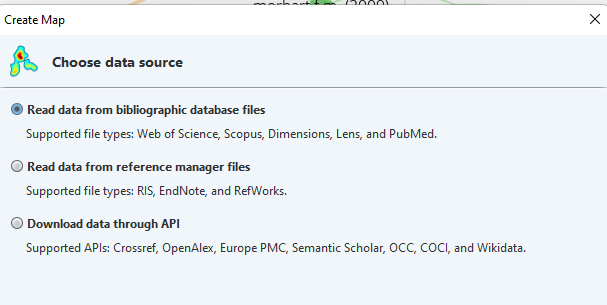
Some sources that VOSviewer supports In Saini, Lievens & Srivastava (2022), VOSviewer is used in two main ways. Firstly, it is used to measure the performance of documents, authors, sources, and organisations by generating the top 10 most cited documents, top 10 most cited authors, top 10 most cited sources and top 10 most cited organisations.
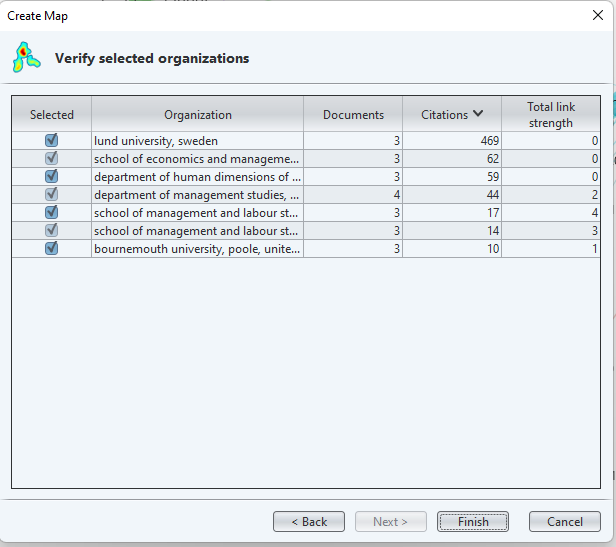
Top 10 most cited organisations according to VOSviewer for a set of papers on employer and internal branding extracted from Scopus. The other use is to cluster the papers with bibliometric coupling to understand the domain and detect evolving themes.
Very user-friendly interface and reasonable out of the box layout settings
While you cannot get away from the challenge of understanding bibliometric jargon in the use of such tools, it is fair to say that it does not help that most mapping tools have interfaces that are dated and where usability feels like an after-thought.Not so for VOSviewer. While it uses Java, it is designed with sensible defaults and importantly guides you along nicely on the next thing you need to do to complete the visualisation.
If you have some basic understanding of bibliometrics, you can quickly generate a decent nice-looking visualisation in less than 10 clicks.
One thing I have noticed about VOSviewer is that unlike other tools which often require me to struggle with a ton of settings to get a presentable visualisation, the default visualisation settings on VOSviewer do the job adequately.
Don’t get me wrong, there are numerous options to tweak the settings from renaming labels, zoom features, changing layout and clustering settings but you do not have to if you do not want to. Given that VOSviewer claims that older tools do not focus much on graphical representation aspects of bibliometric maps and they hope to change this with VOSviewer, it is fair to say they have mostly succeeded.
Create and share interactive visualisations with anyone via VOSviewer online
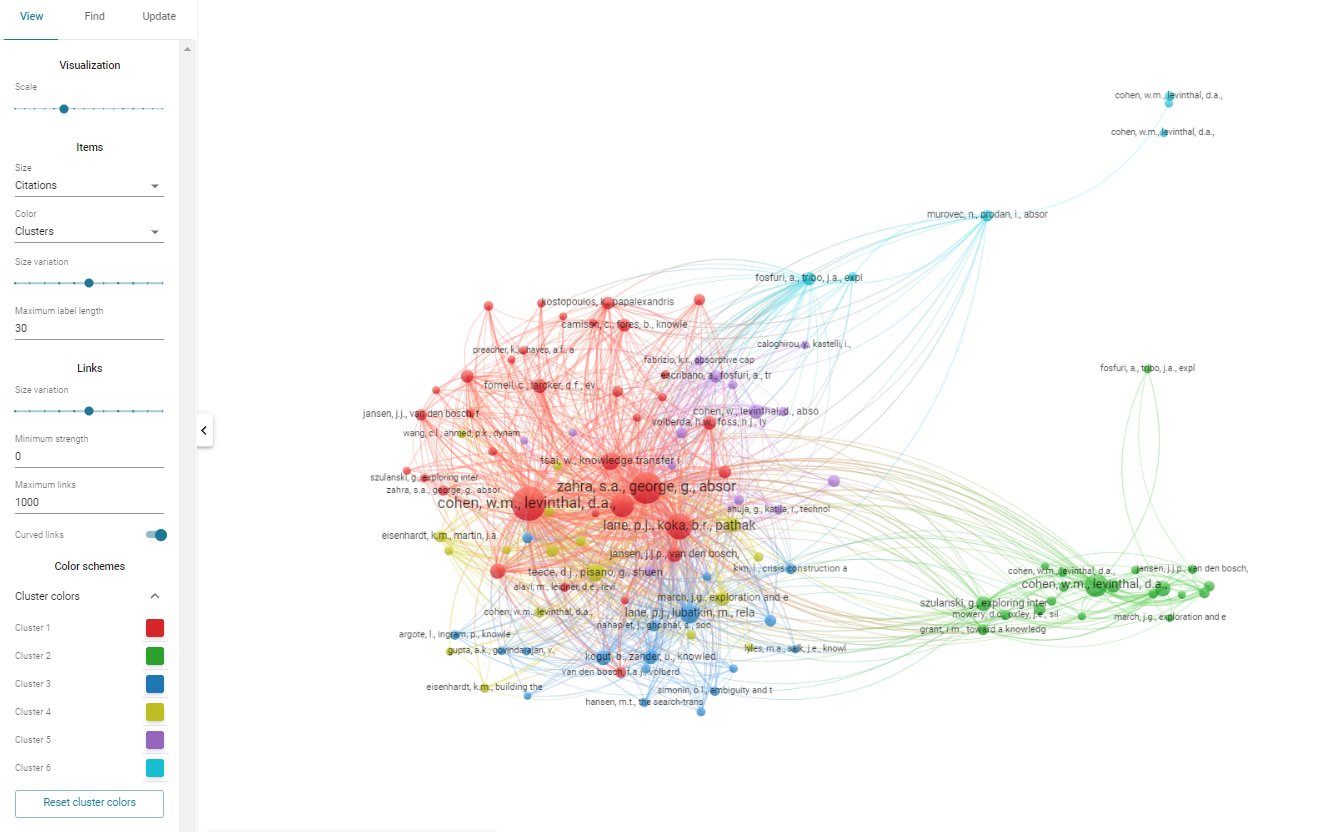
As nice as the visualisations generated by bibliometric mapping tools are, they tend to end up being presented to others as a static screenshot image, which can be difficult to interpet and cannot be engaged with.This is where VOSviewer shines in that they provide a quick and effortless way to share the map visualization created in VOSviewer software to be made available as a dynamic visualization on the web-based VOSviewer platform.
All you need is to do is click “share”, select one of the 3 cloud based services (Google Drive, Dropbox or Onedrive) and a interactive visualization will be made available on the web-based VOSviewer platform that you can share with anyone. You can even embed the dynamic visualization!
To illustrate this in action, you can click on the following link to see a dynamic visualisation of an analysis I did a while back covering papers on the concept of absorptive using bibliometric coupling.
Cons
- Terms co-occurrence does not do stemming
- Unable to do temporal bibliometric analysis unlike tools like Bibliometrix/Biblioshiny, Citespace or CitNetExplorer
- Produces mostly network graphs and is unable to produce other visualisations like tree map, spectrogram, geospatial maps etc.
While VOSviewer is a very capable tool, it has its limitations. Therefore, a lot of bibliometrics reviews use a mix of bibliometric tools. In the business domain, one common combination is to supplement VOSviewer with Biblioshiny.
One reason for this is the inability of VOSviewer to provide other types of visualisations beyond network graphs. From simple lines charts showing growth of papers by keywords to more complex trend topic analysis visualisations to temporal trend analysis, Bibliometrix/Bibliometrix does it all. In particular, Bibliometrix/Biblioshiny offer a thematic analysis option that plots clusters of keywords along two dimensions (Density vs Centrality). This is extremely useful in spotting emerging clusters and the degree of importance of each cluster. We will discuss this feature in a future piece covering this tool.
Some final advice and tips
While VOSviewer can handle large numbers of documents when doing the visualisation, it is often better to limit the number of documents shown by increasing the citation threshold because this makes it easier to see clear patterns. For example, for most citation-based analysis maps, you may want to limit to less than a thousand documents. Similarly for keyword co-occurrence maps, you may want to visualise only the top 100 keywords or it gets difficult to make out what papers are in each cluster.
Don’t get lulled into the ease of making visualisations in VOSviewer, you should have a question in mind before you even start to analyse.
As always, if you have any questions or comments on these tools, I can be reached at aarontay@smu.edu.sg.
Reference
Saini, G. K., Lievens, F., & Srivastava, M. (2022). Employer and internal branding research: a bibliometric analysis of 25 years. Journal of Product & Brand Management, (ahead-of-print). https://doi.org/10.1108/JPBM-06-2021-3526