by Aaron Tay, Lead, Data Services
In April 2022, we talked about how reviews in the business, accounting and management areas are rising in popularity. We then focused on bibliometric reviews (See an example of a recent paper by SMU author), which combine the use of bibliometric analysis with domain know-how to study trends and patterns (e.g., the conceptual, intellectual and social structure of a field).
A quick survey of the literature suggested the following were the most popular:
- VOSviewer (our Research Radar piece)
- Harzing’s Publish or Perish (our Research Radar piece)
- CiteSpace
- Bibliometrix/BiblioShiny
The first three were no surprise to me, as they have been around for over a decade. For example, VOSviewer was launched in 2009, Harzing’s Publish or Perish launched in 2006 and Citespace has been around since 2003! There are many other bibliometric tools of course, but these three tools are not only free but have had a track record of been constantly updated with new features such as the ability to accept new sources of bibliometric data beyond Web of Science and Scopus. This probably explains their popularity.
While other tools both free and commercial like Science of Science (Sci2) Tool, SciMAT and BibExcel exist but based on our analysis currently the fourth most popular tool is a relatively new tool, Bibliometrix , developed by Massimo Aria and Corrado Cuccurullo in 2017.
Why is this tool so popular? In summary, compared to most other bibliometric tools, it provides a full suite of statistical techniques and visualisations (it is particularly strong in providing dynamic visualisations that show change across time) that you can use whether you are doing performance analysis or trying to determine the conceptual, intellectual or social structure of the field. This enables it to provide a full package for science mapping or bibliometric reviews.
Being available as an R package and a Shiny app, it provides the flexibility that a coder can benefit from and yet has the option of supporting non-coders who want the user-friendliness of a graphical interface.
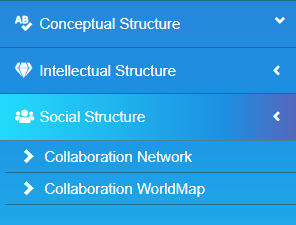
Mostly importantly, Bibliometrix seems to be designed with the “end in mind”. Instead of just exposing dozens of possible bibliometric techniques and visualisations and letting the user decide how to use them, the interface Biblioshiny, groups these techniques under sections like “Conceptual structure”, “Intellectual structure” guiding the user to the appropriate techniques depending on what the user is trying to do.
Setting up and running Bibliometrix and Biblioshiny
Unlike VOSviewer, Citespace or Harzing’s Publish or Perish, Bibliometrix is made available as an open-source R package.
By using the various functions from the Bibliometrix package, you will be able to carry out essential tasks needed for bibliometric analysis, from importing data into bibliographic data frames, running analysis and plot visualisations based on techniques like cocitation analysis.
Not comfortable with R? Use the Biblioshiny app, which will give you an easy to use the web interface to carry out almost all the functions available in Bibliometrix without coding. This makes it equivalent in experience to using VOSviewer, Citespace etc.
The steps to run Biblioshiny are relatively simple, though you do have to install R on your machine. As always if you have problems with this, do approach me for assistance.
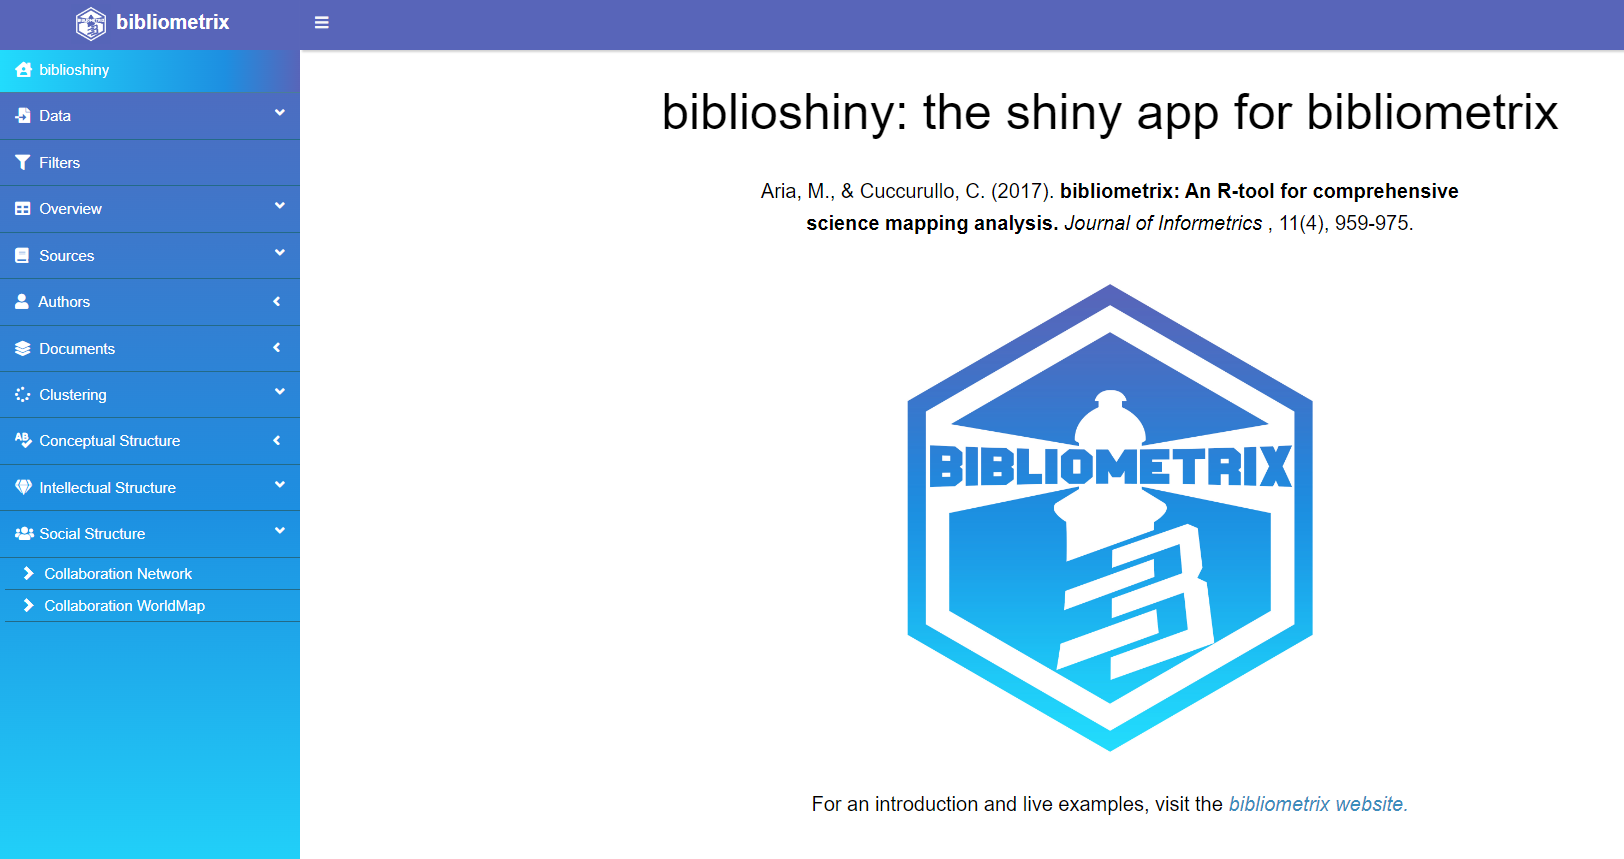
Features of Biblioshiny
According to the 2017 paper introducing the tool, Biblioshiny was designed to not only provide a complete suite of functions to support comprehensive bibliometric analysis but also supports a recommended workflow (with a template) for performing bibliometric studies.
The screenshot below provides an overview of the functions and types of analysis that Biblioshiny supports.
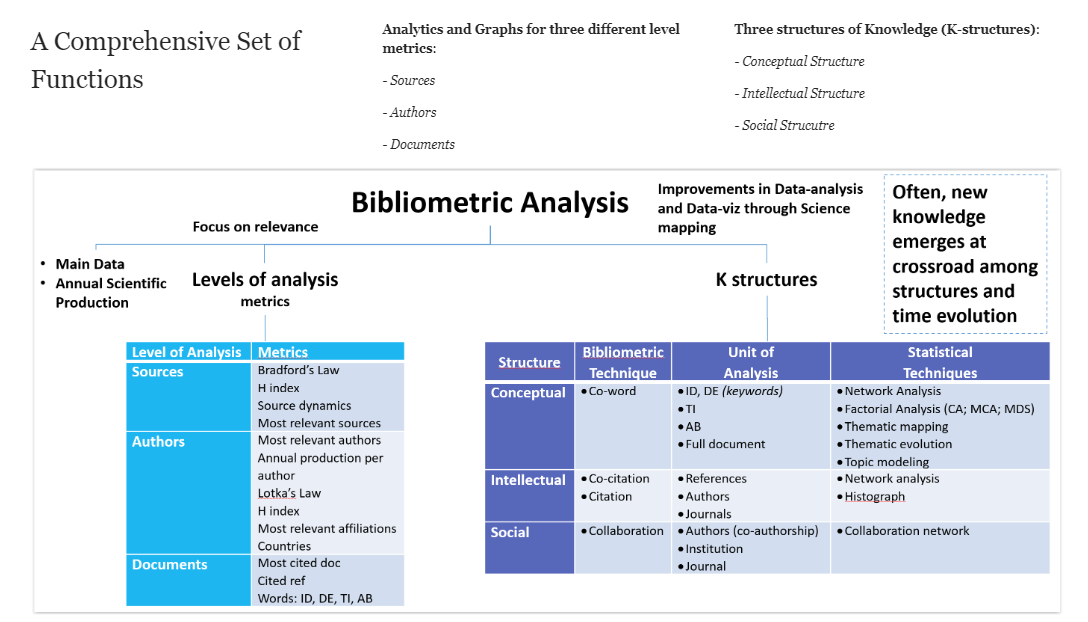
Compared to most other bibliometric tools out there, this tool does indeed provide a more comprehensive suite of statistical techniques and visualisations.
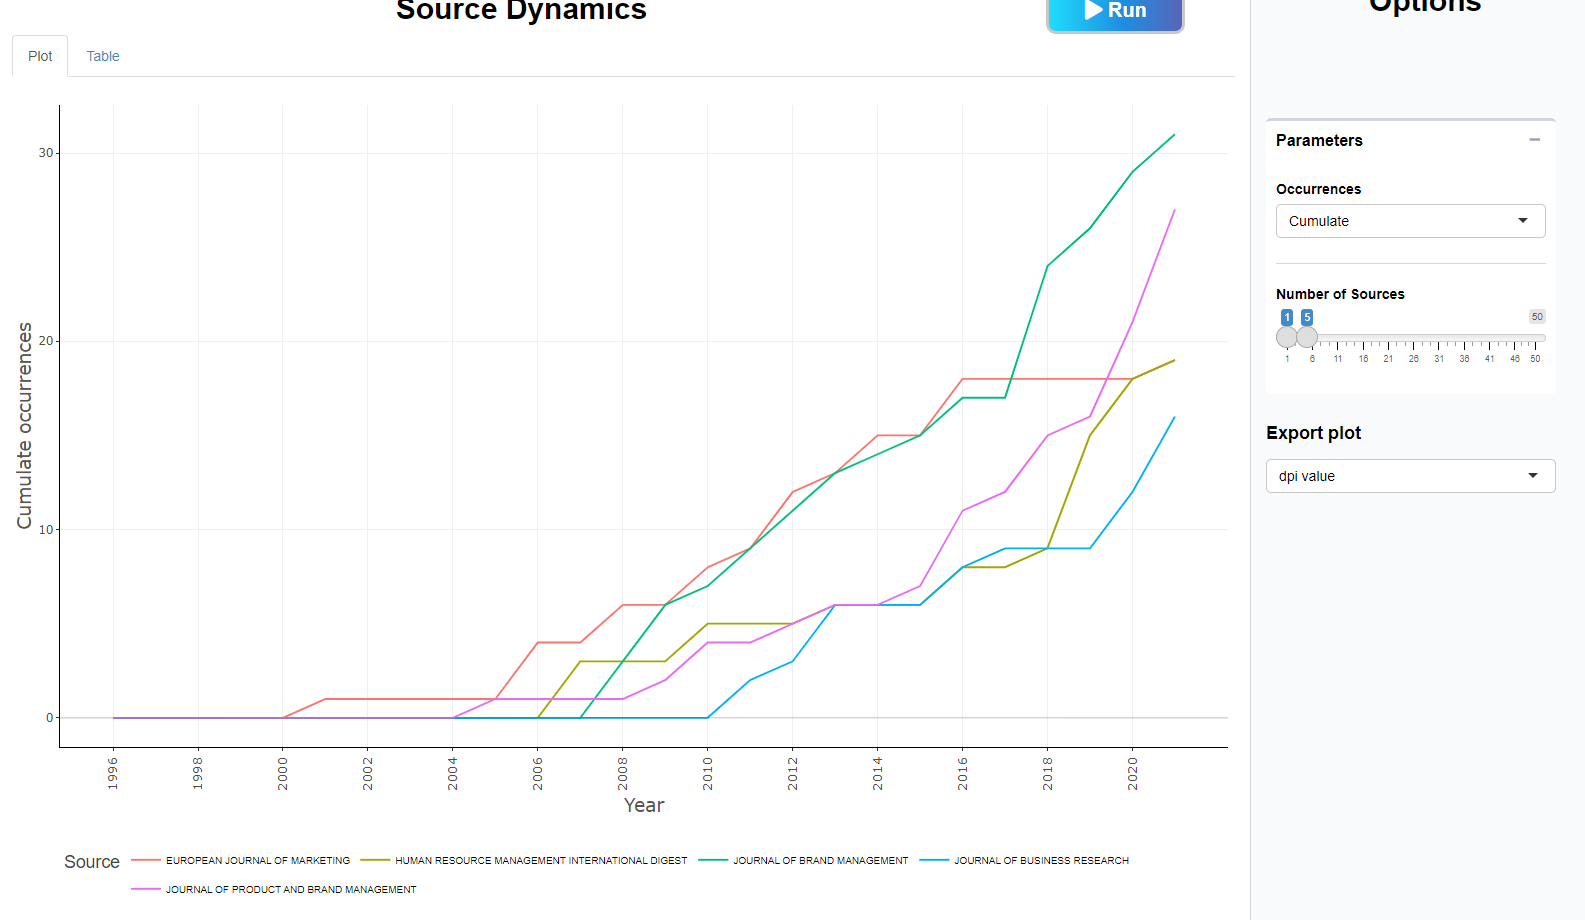
For example, compared to VOSviewer, this tool provides better support for impact performance analysis at multiple levels of analysis (sources, authors, documents) with a wider variety of visualisations. While a lot of these are simple line graphs or tables, this is still something you will not get out of VOSviewer, requiring the use of an additional visualisation tool.
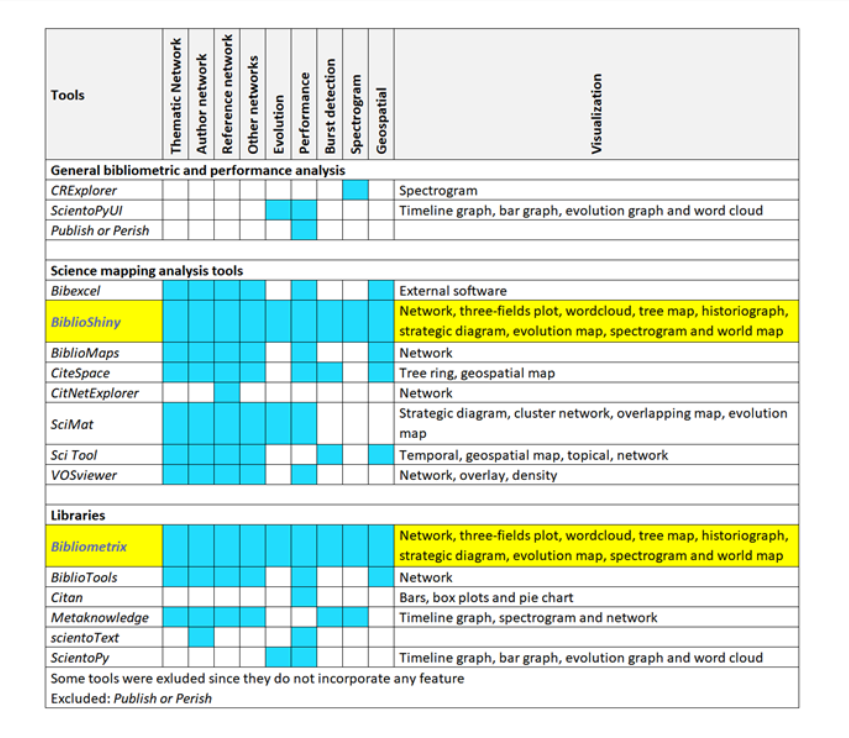
Moreover, unlike VOSviewer, it provides a wide variety of visualisations and techniques beyond just network graphs/maps.
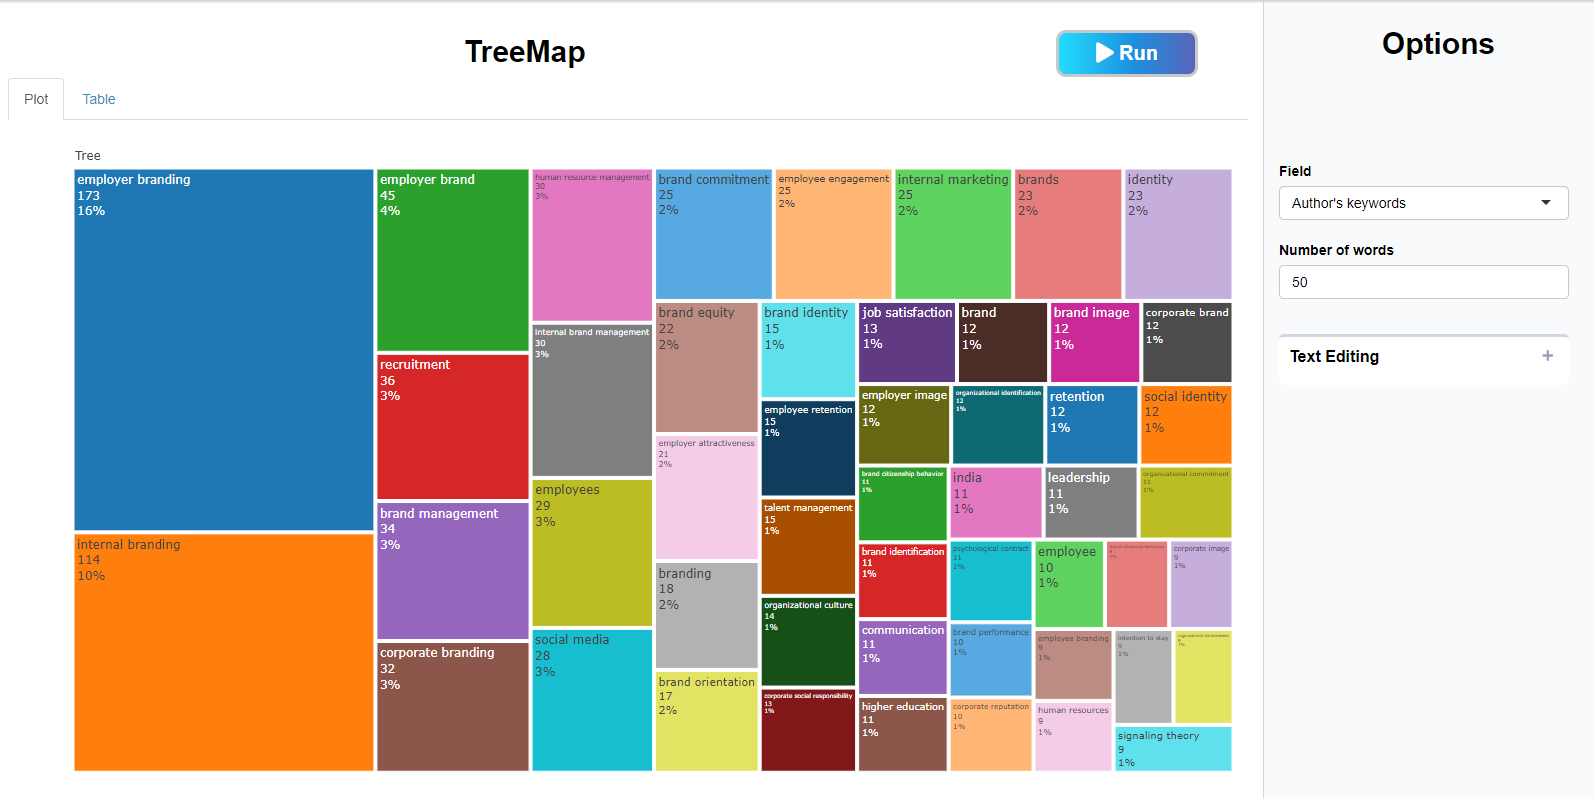
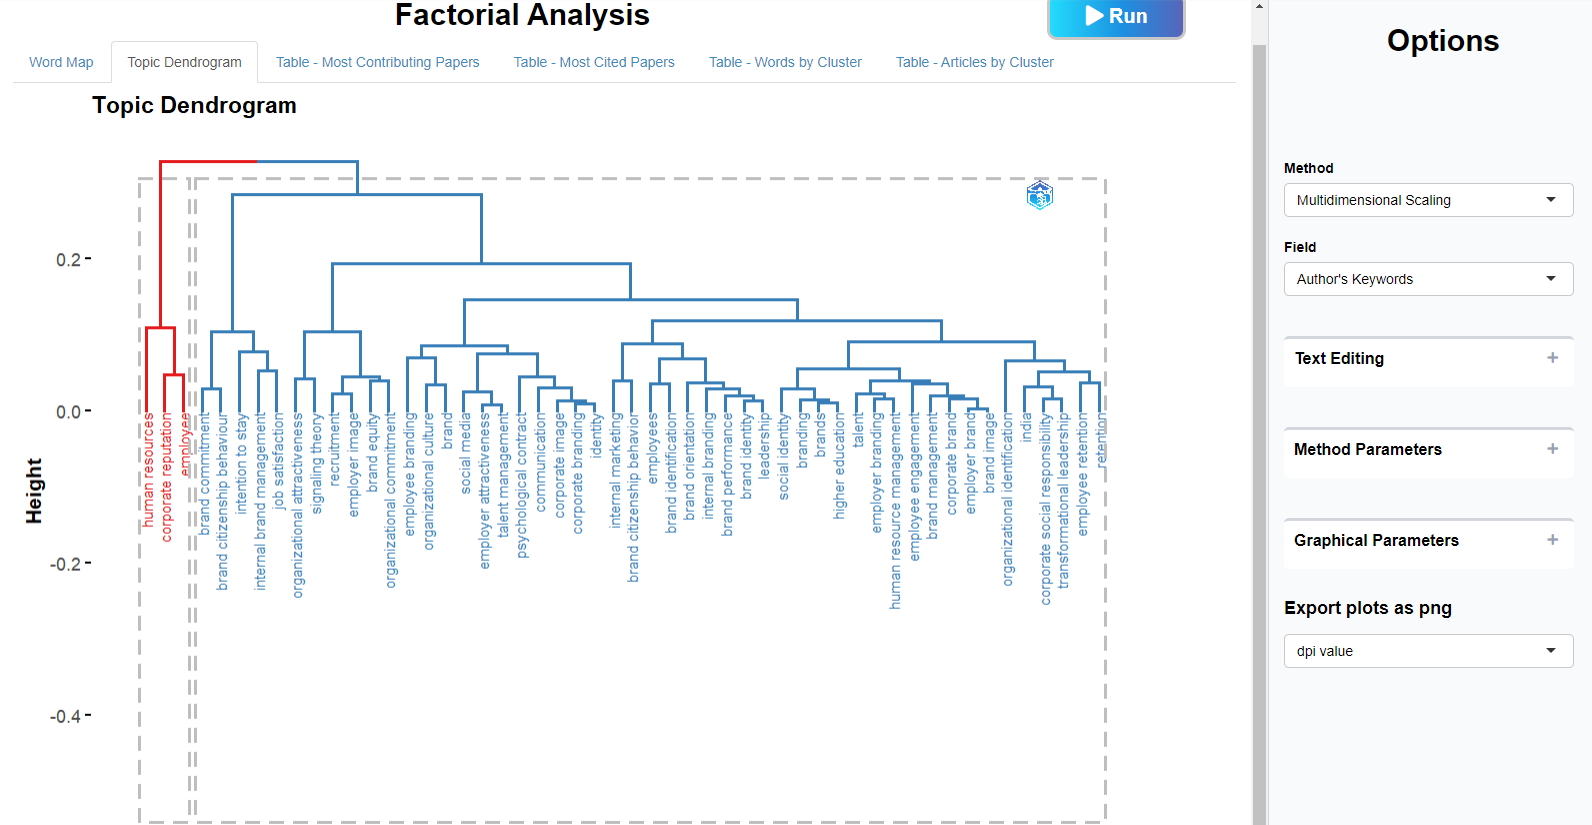
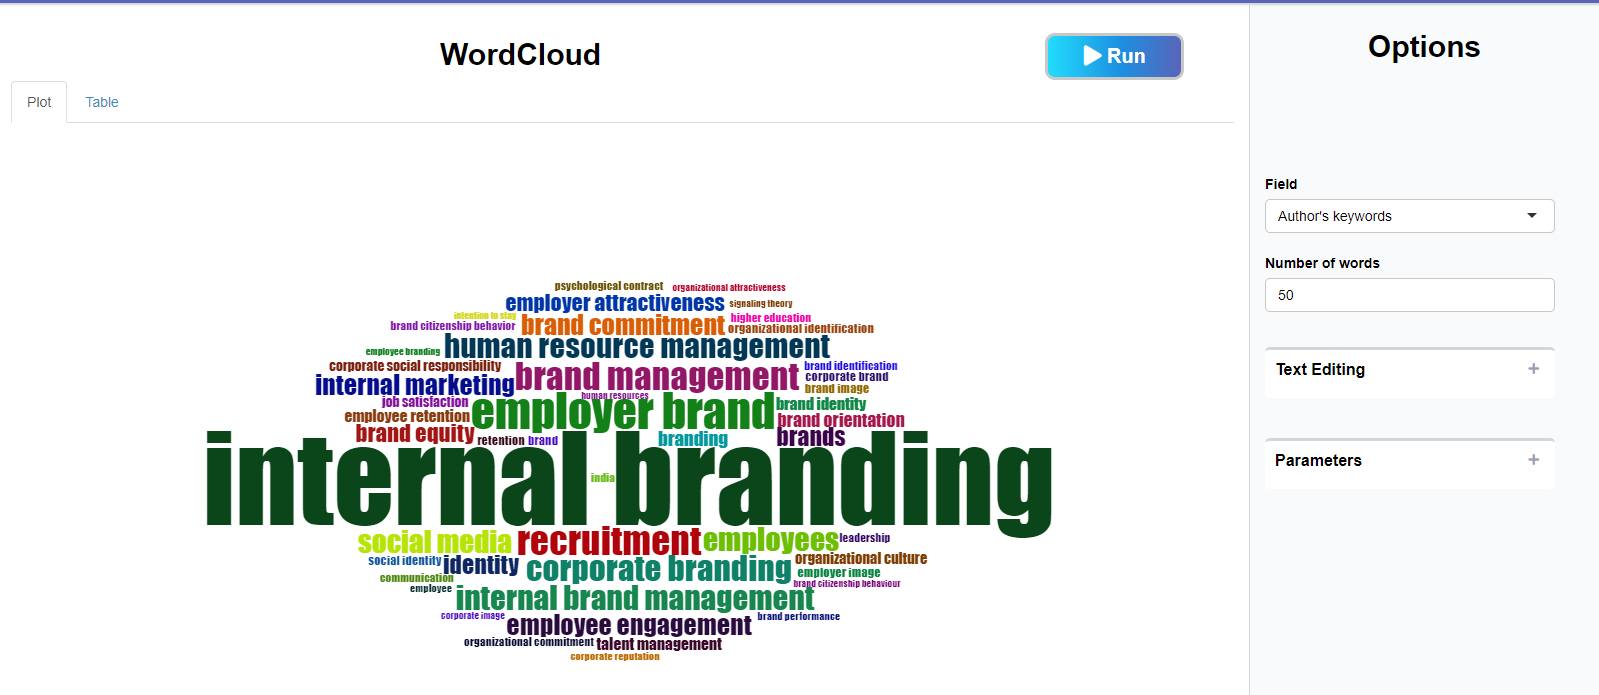
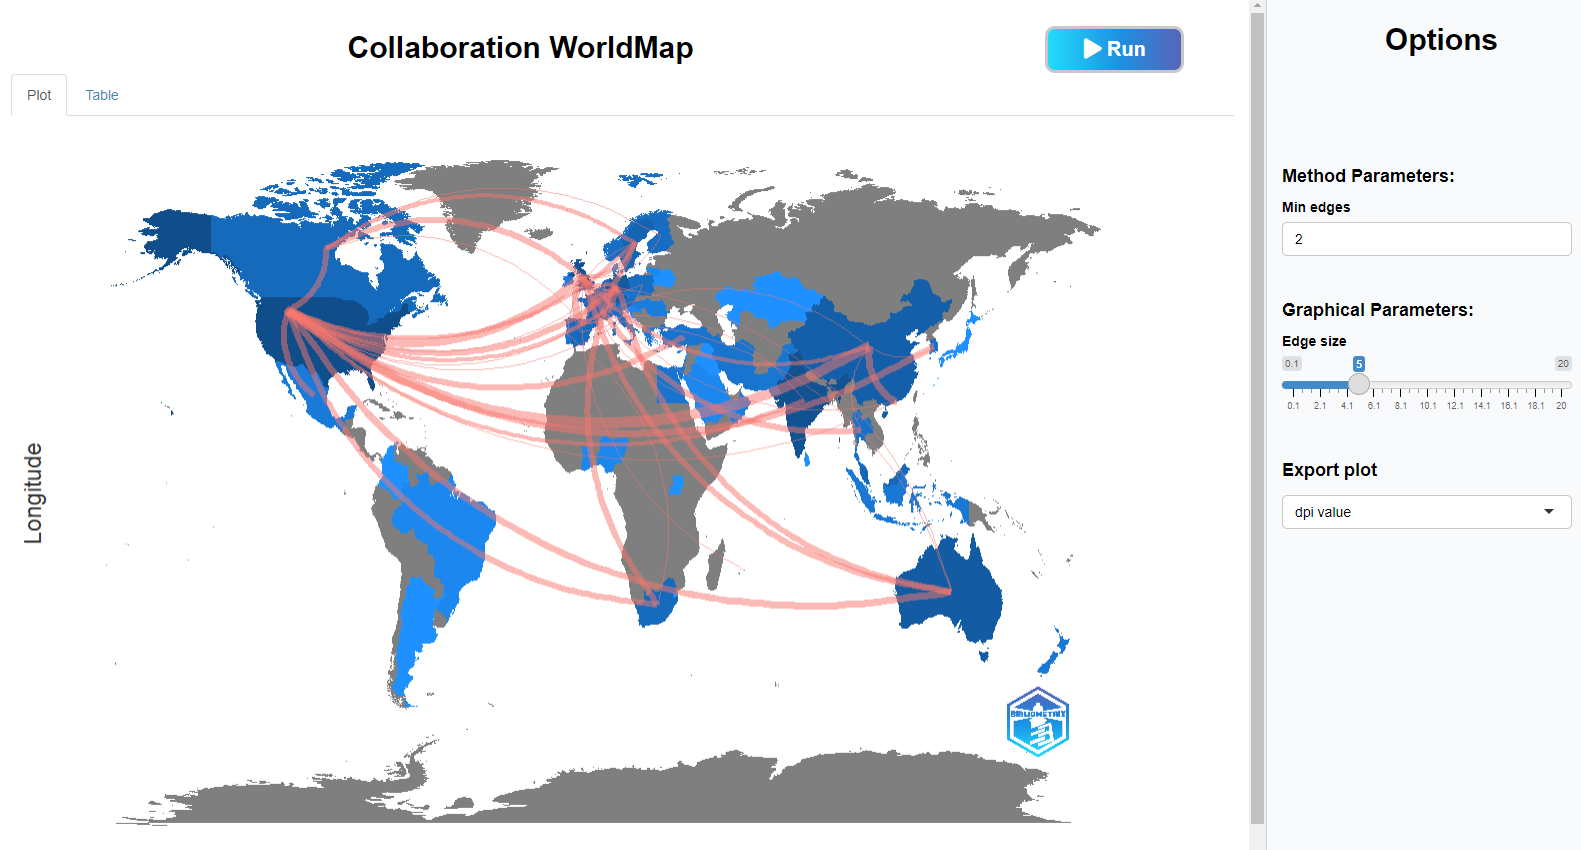
Indeed, the types of visualisations you can do with this tool are impressive, beyond network graphs, it can generate tree maps, line graphs, word clouds, historiography, world maps, dendrograms and more.
Two statistical/visualisation features stand out for me. I was impressed to see it features techniques that support the relatively new Reference Publication Year Spectroscopy (RPYS) used to detect the historical roots of fields (the technique used to be available only via a specialised tool – CRExplorer).
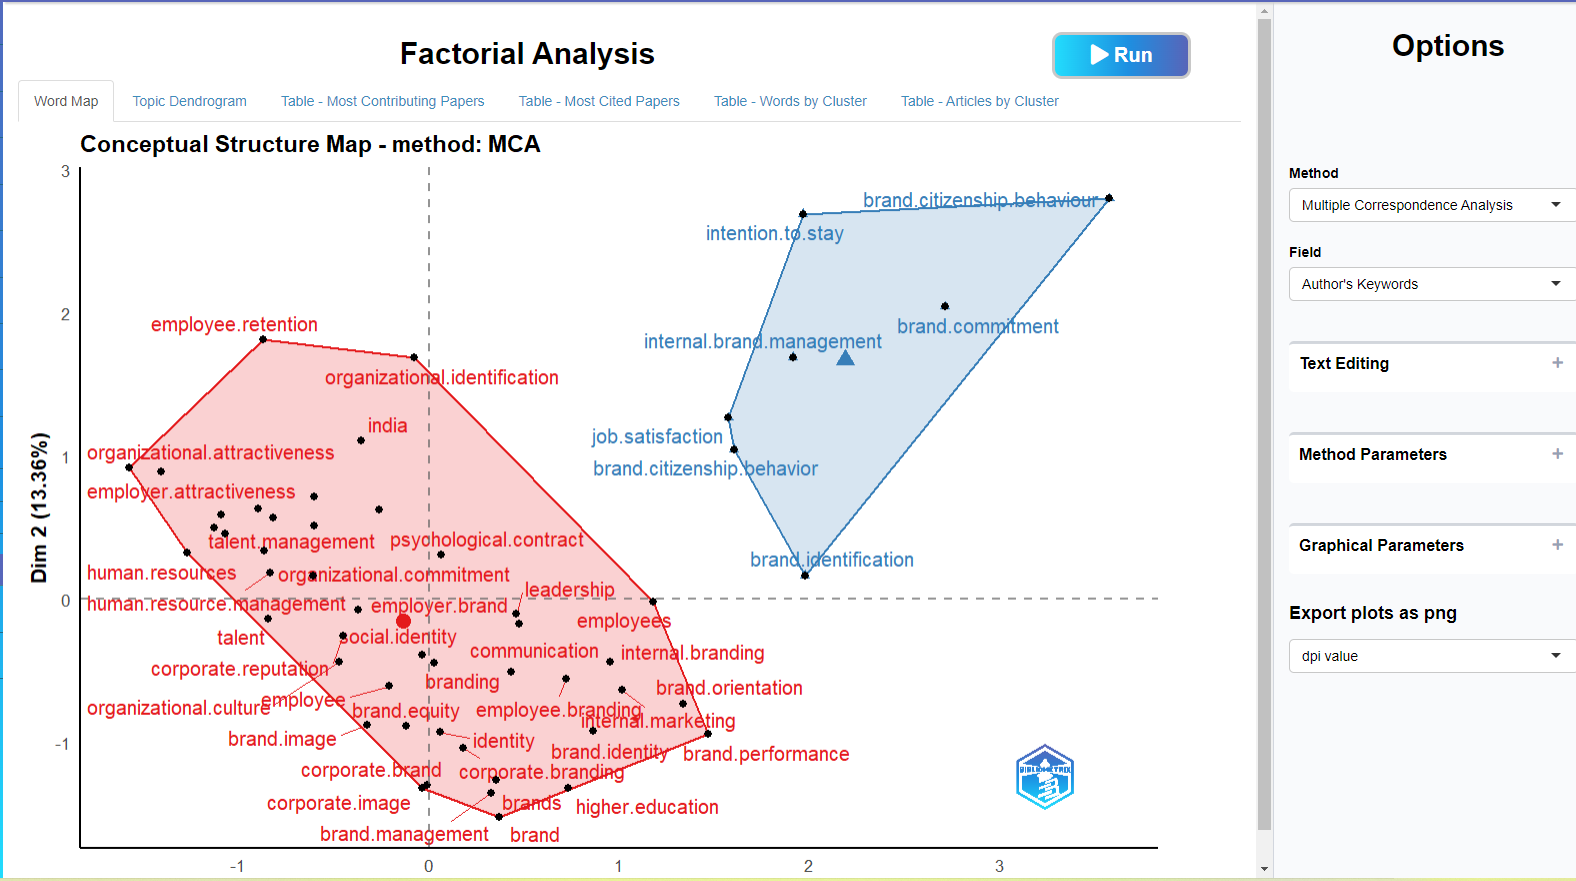
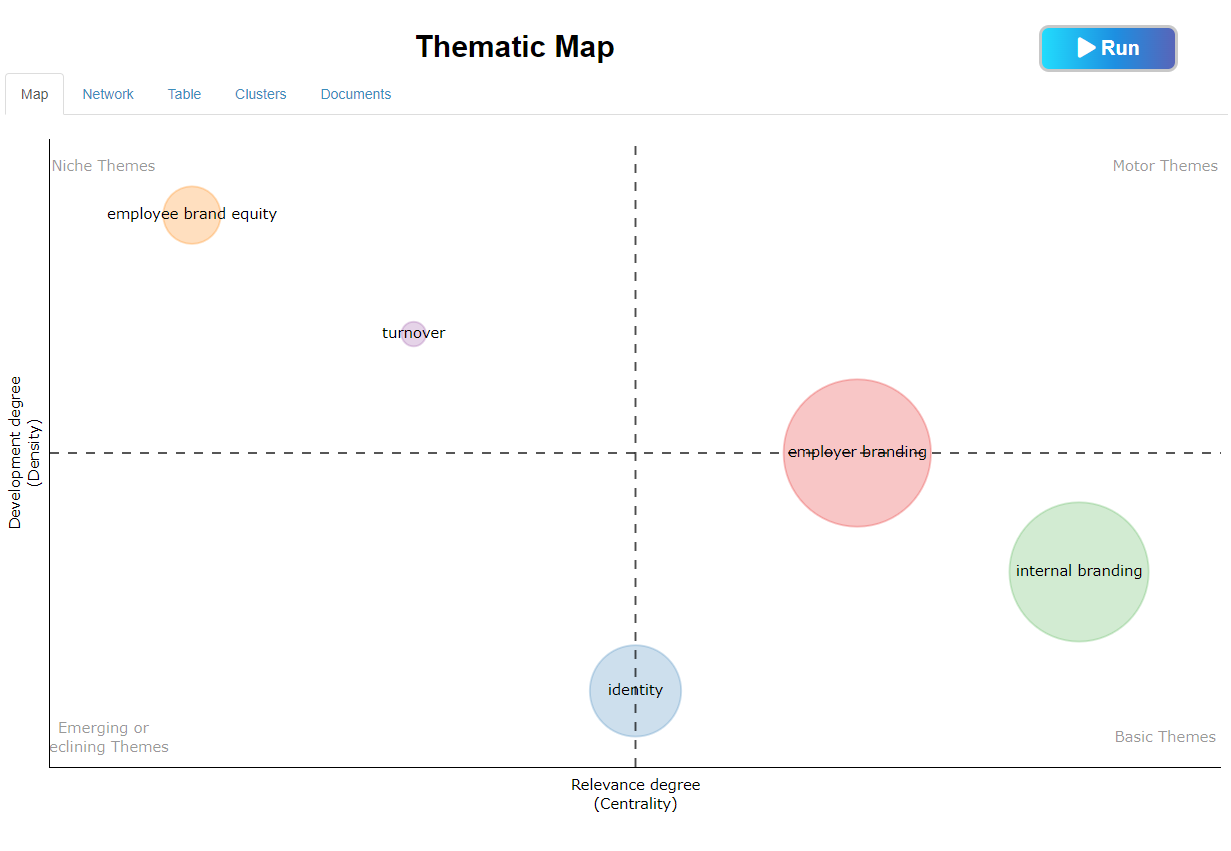
It also supports the visualisation of thematic maps, which allows you to identify clusters along two clusters of centrality and density. This allows you to classify clusters in terms of the level of development (density of connections within clusters) and importance (Centrality measure of the cluster). This Technique is inspired by the proposal in “An approach for detecting, quantifying, and visualising the evolution of a research field: A practical application to the Fuzzy Sets Theory field”.
This I suspect is one of the reasons why it is particularly popular in the business and management area.
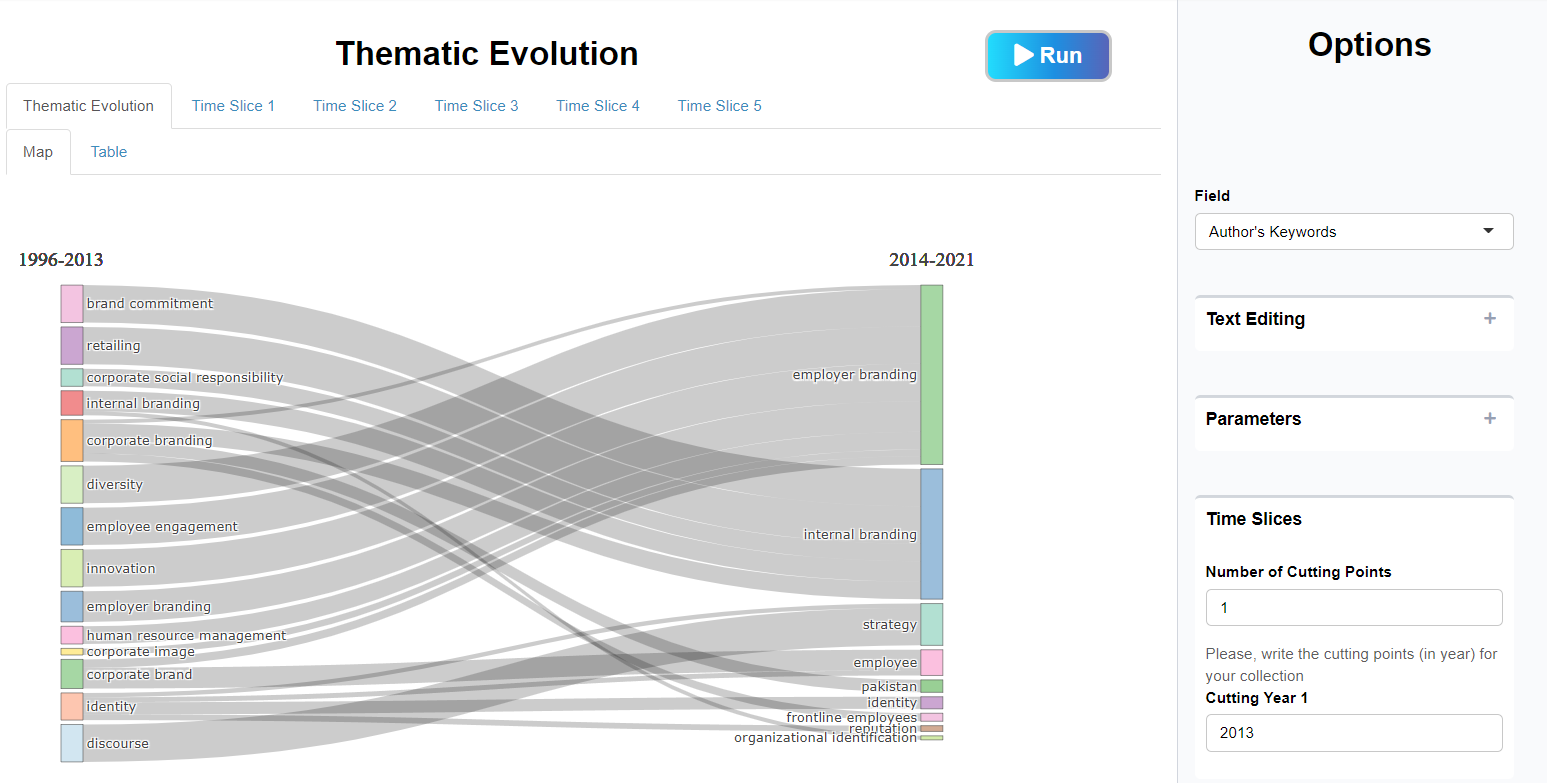
In addition, you are not just limited to a static analysis of the themes, it also allows you to do a temporal analysis of the evolution of themes by choosing time slices (this is also a feature available in CiteSpace but not VOSviewer).
Pros of Biblioshiny
- Unlike tools like VOSviewer which generally specialise in a few visualisation types (in particular network graphs), this tool covers the whole spectrum of statistical techniques and visualisations.
- Compared to VOSviewer and many other tools that present mostly static visualisations, Bibliometrix offers a variety of ways to do temporal or longitudinal analysis. Some examples include:
- Simple line graphs to show changes in frequency
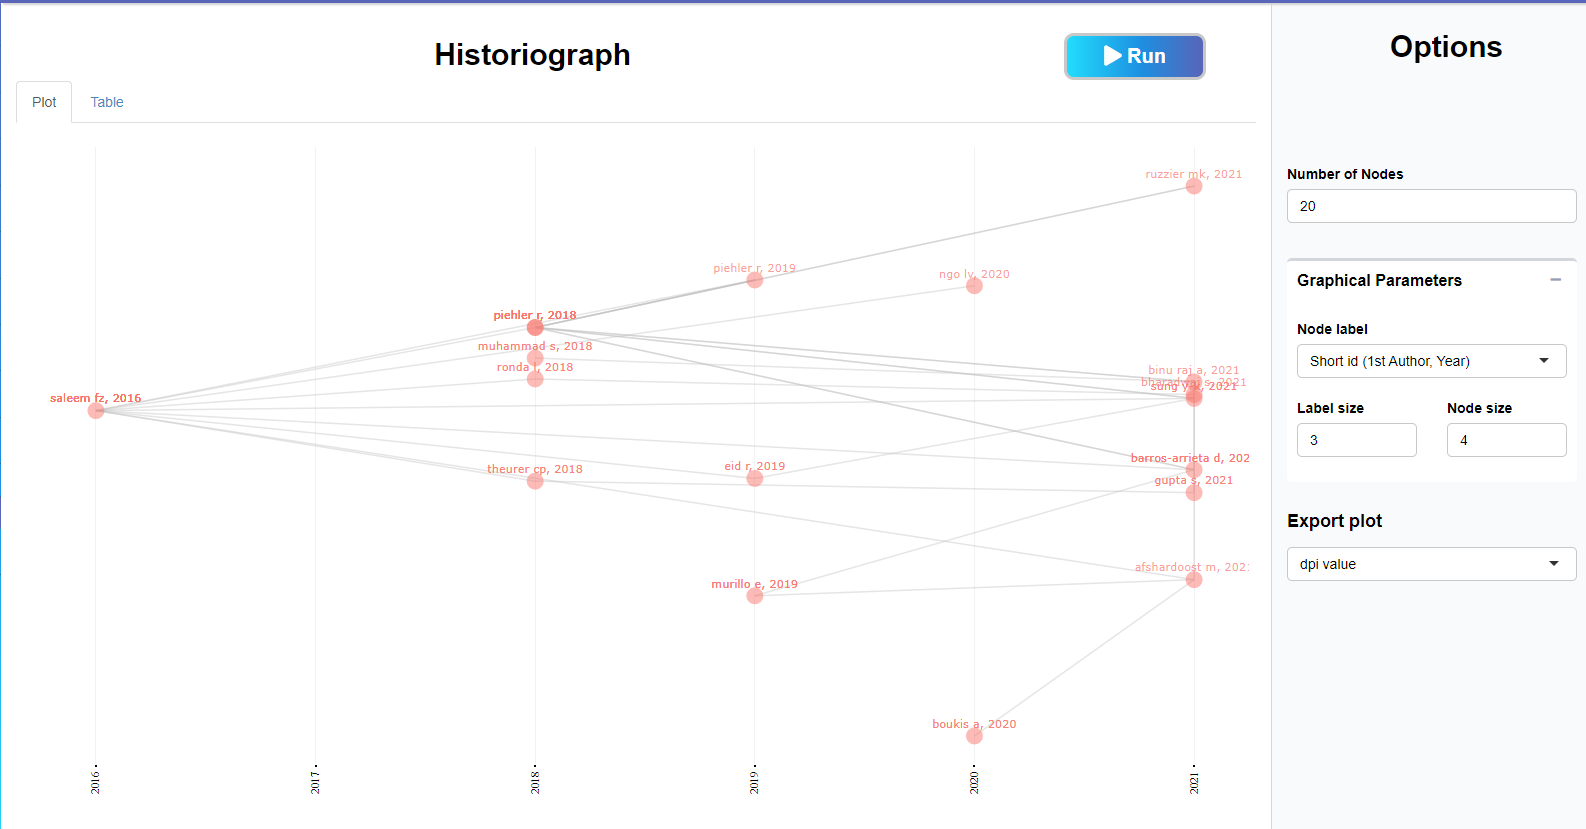
- Historiograph visualisation
- Thematic Map evolution
- Reference Publication Year Spectroscopy
- Lastly, beyond all the features, Biblioshiny uniquely provides a good framework on how to use these features. Most bibliometric analysis tools simply expose all the possible options (e.g., Co-citation analysis, Co-author analysis, Bibliometric coupling, Co-occurrence analysis etc) without guidance on how these analysis can be used. Biblioshiny instead categorises each technique based on purpose. For example, co-occurrence analysis of words or dimension reduction techniques are usually used to study the conceptual structure (what is talked about – themes etc), while co-citation analysis is used for studying intellectual structure (how different works influence each other) and analysis of collaborations is used for social structure (which authors, institutions, countries work with each other). For each one, the tool will suggest appropriate techniques you can try! This is of great help to the user who is not an expert in bibliometric analysis. They even have a recommended template report you can use!
Cons of of Biblioshiny
- Requires R install which might be daunting if you have not used R
- This tool provides support to a reasonable number of sources from the traditional Web of Science, Scopus to the up-and-coming Dimensions, Pubmed and the lesser known Lens.org. You can even use APIs for select sources like Dimensions, Pubmed, Scopus either directly via API or R packages. Still, VOSviewer, CiteSpace, Publish or Perish support still more sources currently.
Conclusion
Bibliometrix and its accompanying shiny app Biblioshiny aims to be “A full package for Science Mapping Workflow” and I believe it has indeed accomplished this. I highly recommend it as one of the tools to be considered when doing science mapping or bibliometric reviews.
Related Articles
- An approach for detecting, quantifying, and visualizing the evolution of a research field: A practical application to the Fuzzy Sets Theory field
- bibliometrix: An R-tool for comprehensive science mapping analysis
- Harzing’s Publish or Perish 8.0
- Employer and internal branding research: a bibliometric analysis of 25 years
- Using VOSviewer as a bibliometric mapping or analysis tool in Business, Management & accounting