by Aaron Tay, Lead, Data Services
This is the final piece of the series covering the use of popular bibliometric or science mapping tools used in Business & Management.
A quick survey of the literature suggested the following were the most popular:
- VOSviewer (our Research Radar piece)
- Harzing’s Publish or Perish (our Research Radar piece)
- CiteSpace
- Bibliometrix/BiblioShiny (our Research Radar piece)
In this post, we bring this series to a close by covering CiteSpace by Chaomei Chen.
Quick Summary
CiteSpace is by far the most feature-rich tool among its peers and allows you to create and employ cutting-edge bibliometric techniques and visualisations. The twitter account @citespace provides a constant stream of dazzling visualizations created by the author himself with CiteSpace that make you want to run to fire up Citespace to play.
Among many powerful features, Citespace provides the opportunity to study the evolution of your generated maps time slice by time slice, a unique capability not found in all but specialized science mapping tools.
All this power comes with a cost. This tool is designed for the bleeding edge and advanced user who isn’t afraid of bibliometric jargon and it shows in the less than intuitive and numerous buttons, menus and options available.
Setting up CiteSpace
To start, you will need to setup a Project in Citespace, create folders for your dataset and then put the exported data into the right folder.
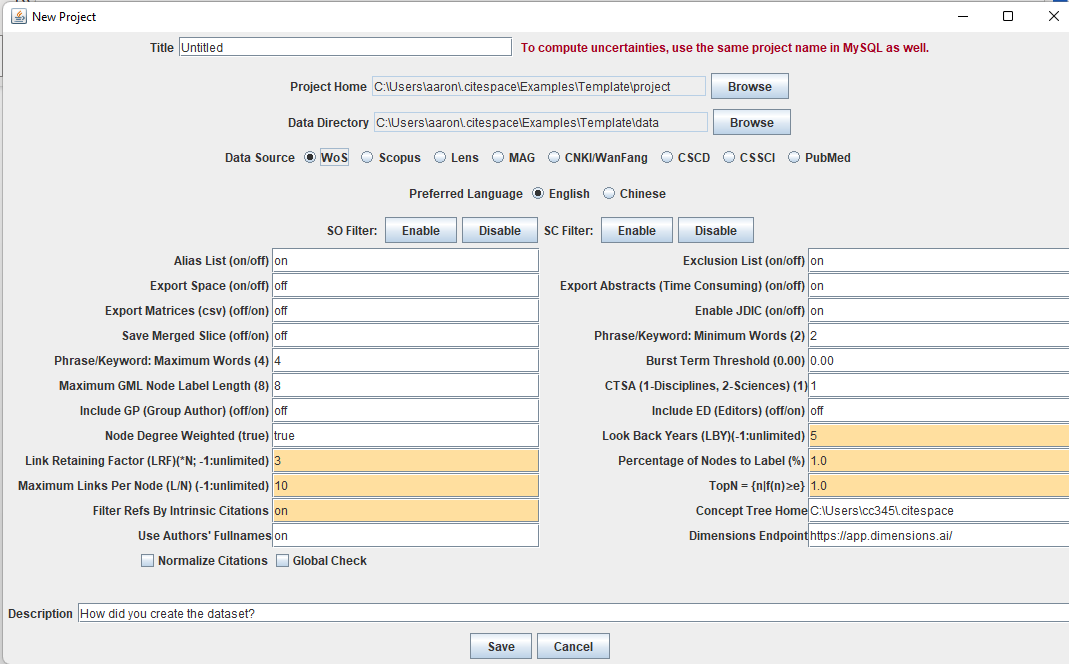
As you can see above besides Web of Science, CiteSpace supports Scopus, Lens.org, Microsoft Academic Graph (MAG, now defunct), CNKI , Pubmed etc.
While this is true, if you are not using Web of Science, you will need to convert the file downloaded and this can be quite tricky. See for example the process for Lens.org.
For this exercise, I will use the demo data from Web of Science on Terrorism that is available by default.
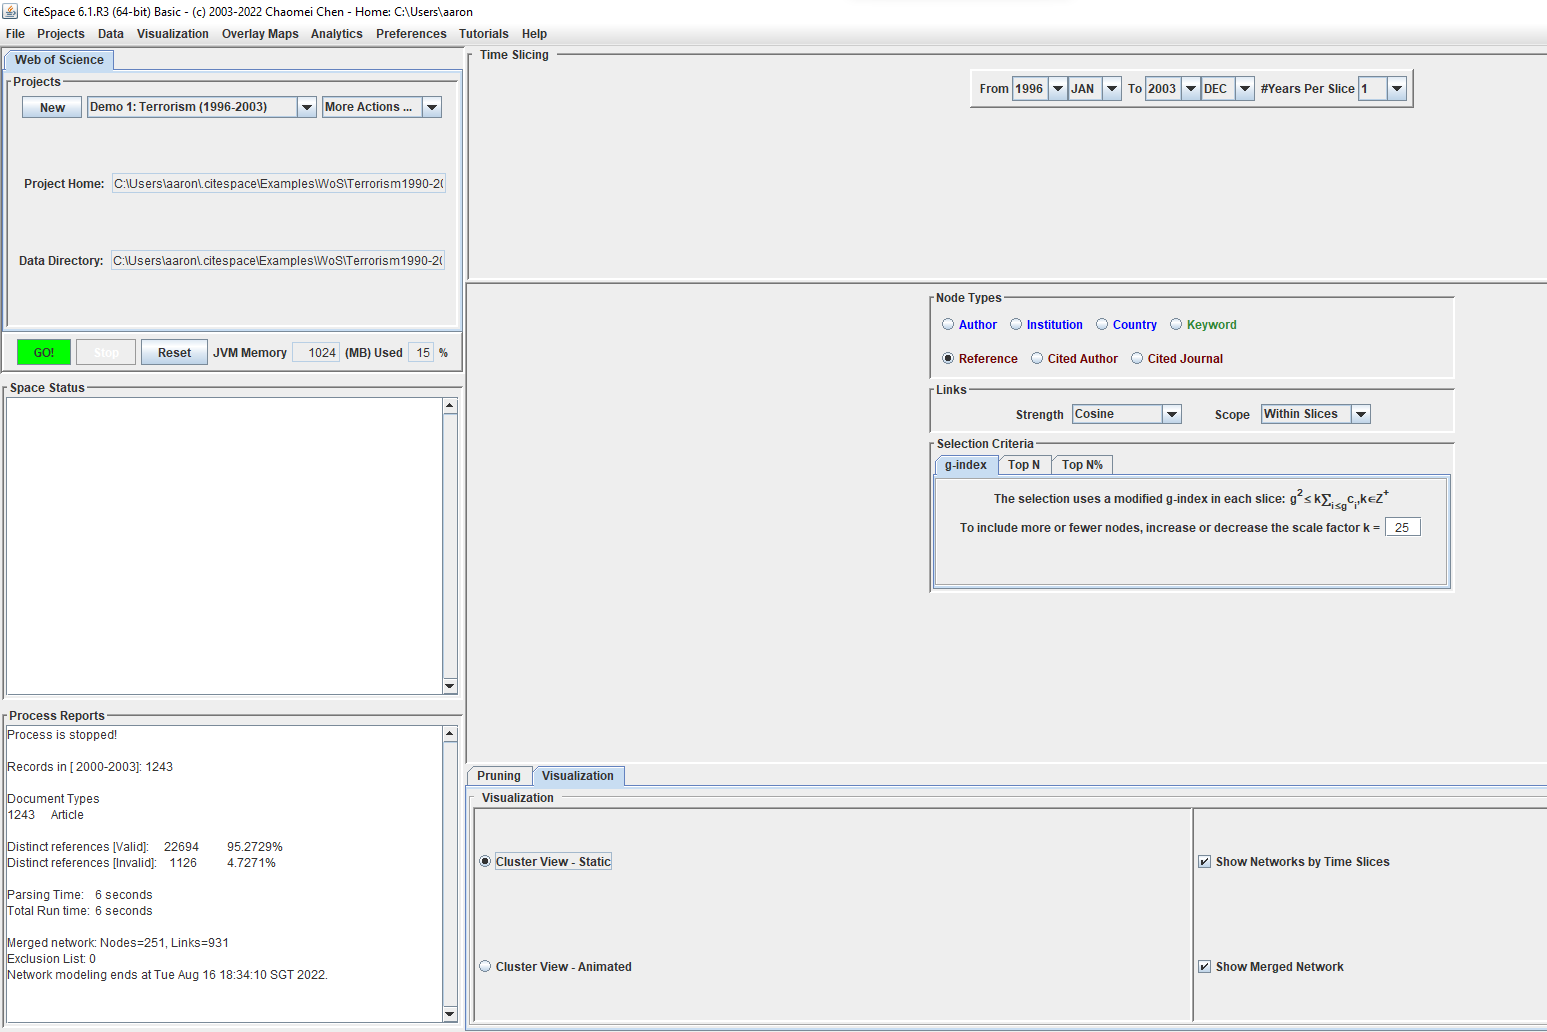
While there are a lot of features when setting up, I draw your attention to the “time slicing” window on the top right. This time slicing feature allows Citespace to produce analysis in “time slices” of 1 or more years and is helpful if you want to see the evolution of the area of study. We will see how this works later. For now, I will click the green “Go” button.
If there are no errors, a new window will open and a visualisation will be presented. For most typical cases, you will see a pretty rough-looking graph visualisation and in theory, you should wait for the layout to finish unfolding.
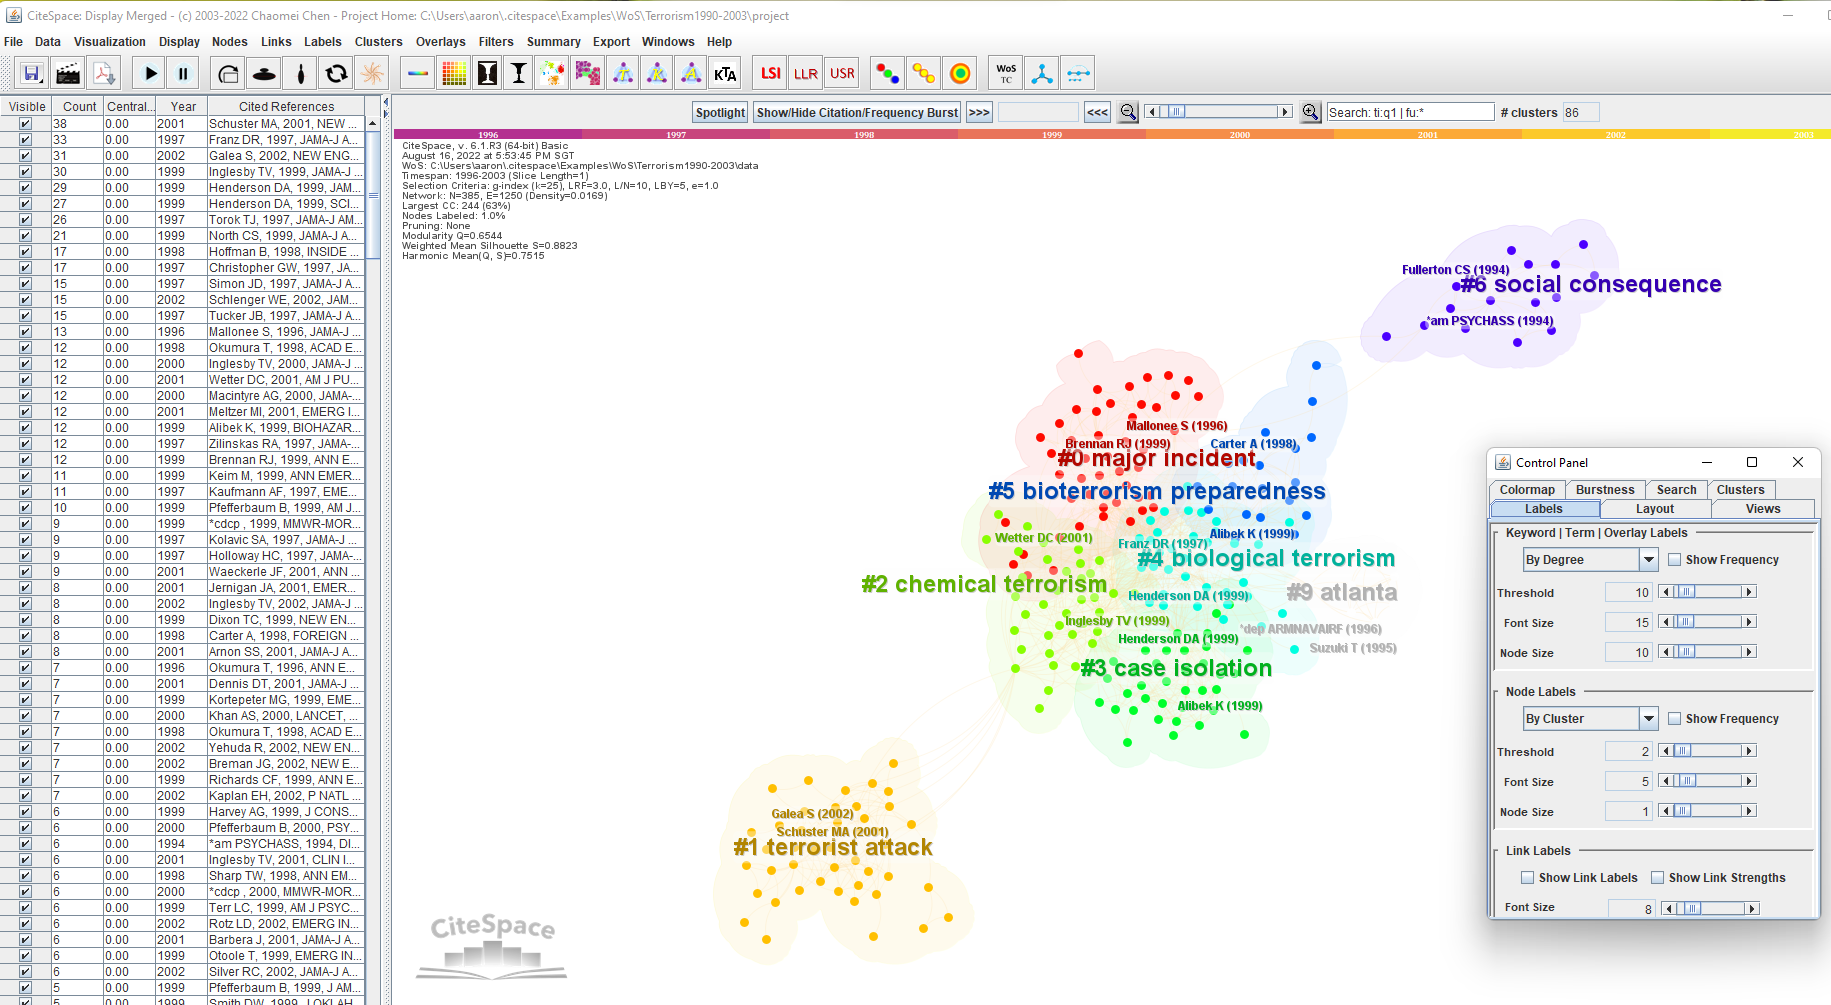
Once that is done (or you can press the stop button), you need to do a variety of steps before the visualisation becomes presentable. These include pressing buttons to “find clusters”, “label cluster with title/keyword/abstract terms”, “toggle node color by cluster membership” and more.
Most people who are new will struggle with all these steps since you are not guided. To solve this problem, there is now a “All in one: clustering layout and style” button just below the Summary menu that will do all that in one step.

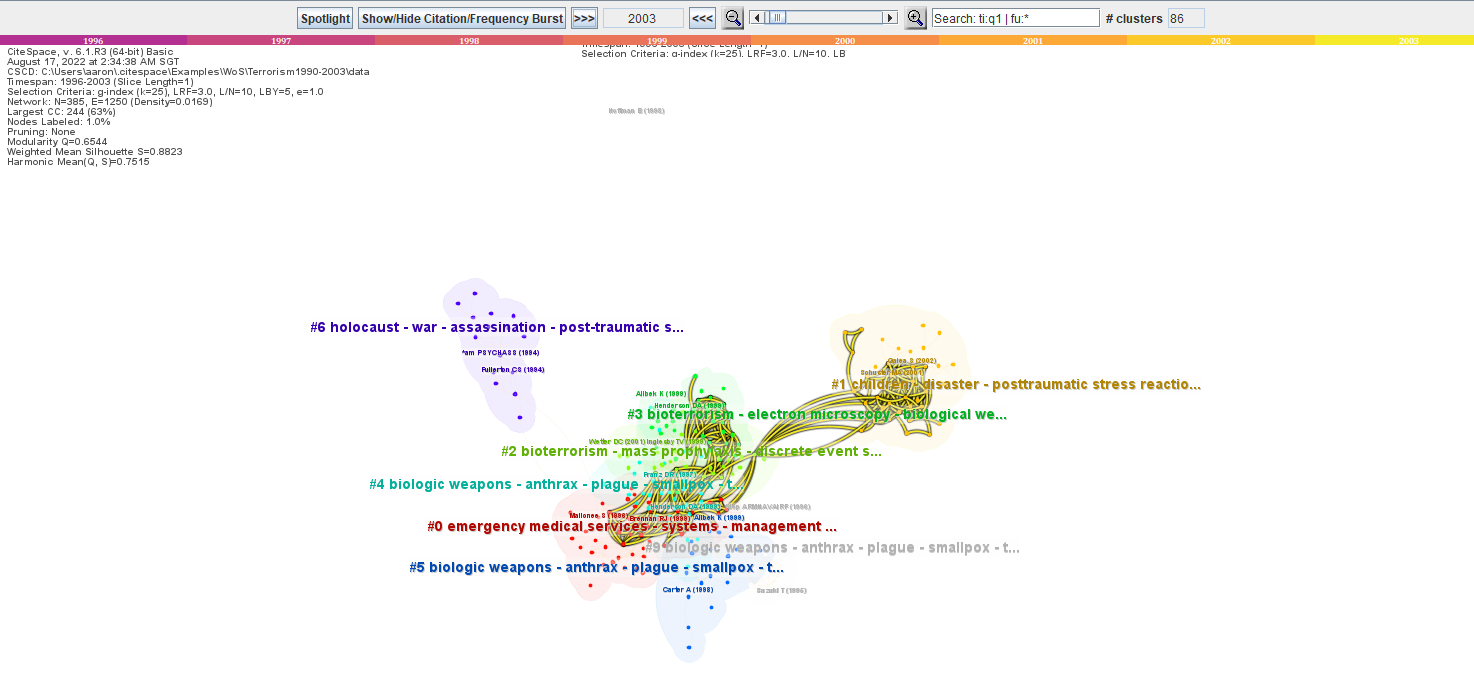
This gets what is called the cluster view.
In the cluster view you can step through the time slices you defined earlier to see how the network evolved (in this case cited reference) across time. The colours of the linkages correspond to the colour bars (1 for each year) on the top of the screen. You can combine this with “show citation/frequency burst” to spot hotspots.
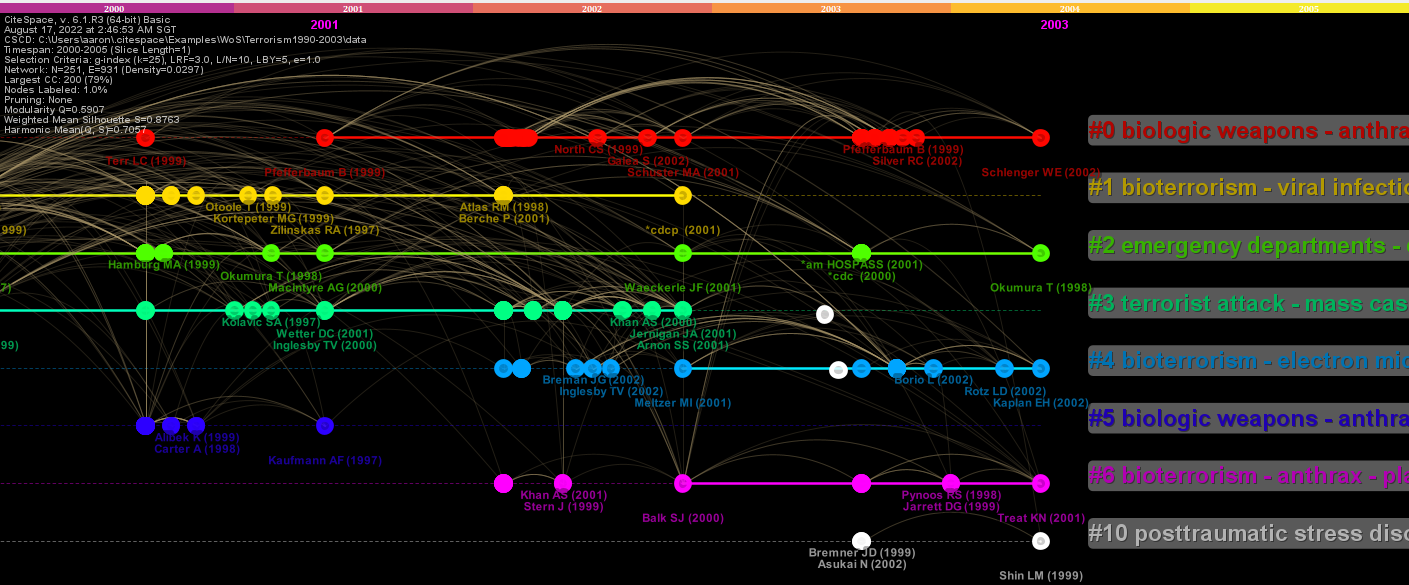
The other major visualisation in CiteSpace besides cluster view is timeline view.
As you can see below it arranges papers in horizontal timeline rows with each cluster representing one row and papers representing nodes on the timeline.
As you step through the time slices you can again see how the network evolved.
Conclusion
This short overview only scratches the surface of what you can do with Citespace.
There are many more features and settings you can play with in Citespace such as turning on citation tree ring history (where “concentric citation rings represent how many citations were made to the node in corresponding years.”), options for you to visualise almost any graphical aspect of the visualisation you wish including colours, size of label, the technique used to extract labels etc.
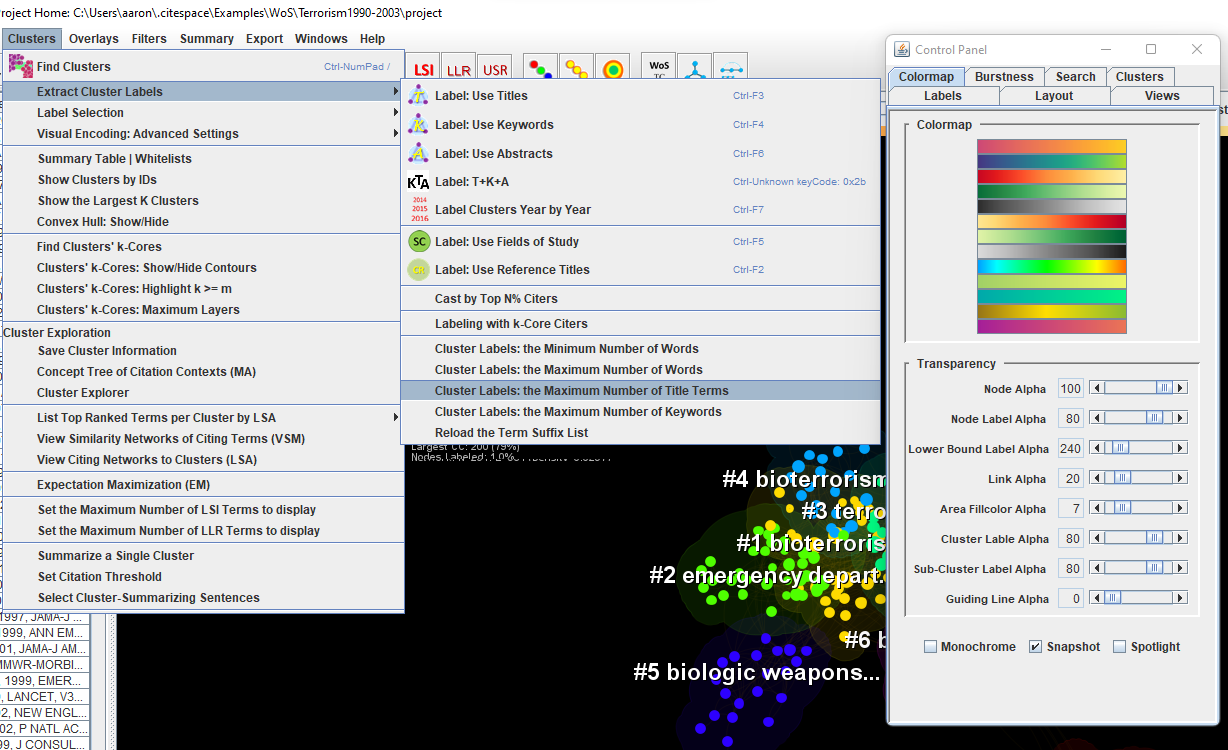
But this is in fact CiteSpace’s great weakness, there are so many options that all but the most accomplished bibliometrics expert will risk getting overwhelmed. So if you wish to use CiteSpace as your preferred bibliometric mapping tool of choice, be prepared to spend a long of time studying this tool. For most people, they are better off with a simpler tool like VOSviewer or Bibliometrix.